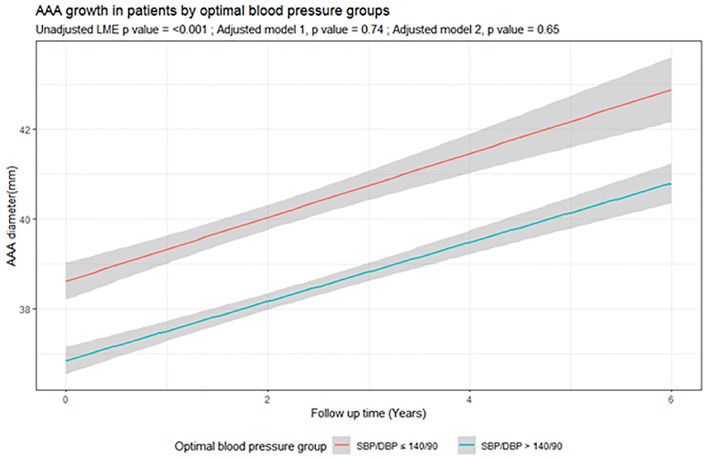
Figure 1.
Association of optimal blood pressure with abdominal aortic aneurysm growth. The graph illustrates the mean growth (95% CI) of AAA growth during follow up (years) according to optimal blood pressure in AAA patients. The red line represents patients with BP ≤140/90 mmHg and the green line represents patients with SBP >140 or DBP >90 mmHg. BP, blood pressure; DBP, diastolic blood pressure; SBP, systolic blood pressure.

