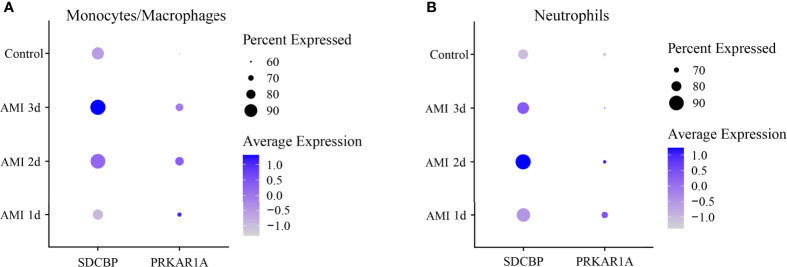
Figure 6.
Dot plot of expression profiles of PRKAR1A (A) and SDCBP (B) in monocytes/macrophages and neutrophils at different time points after AMI. Dot size reflects the percentage of cells expressing the markers in each cell type. The scale color represents the gene expression levels from low to high. AMI, acute myocardial infarction.

