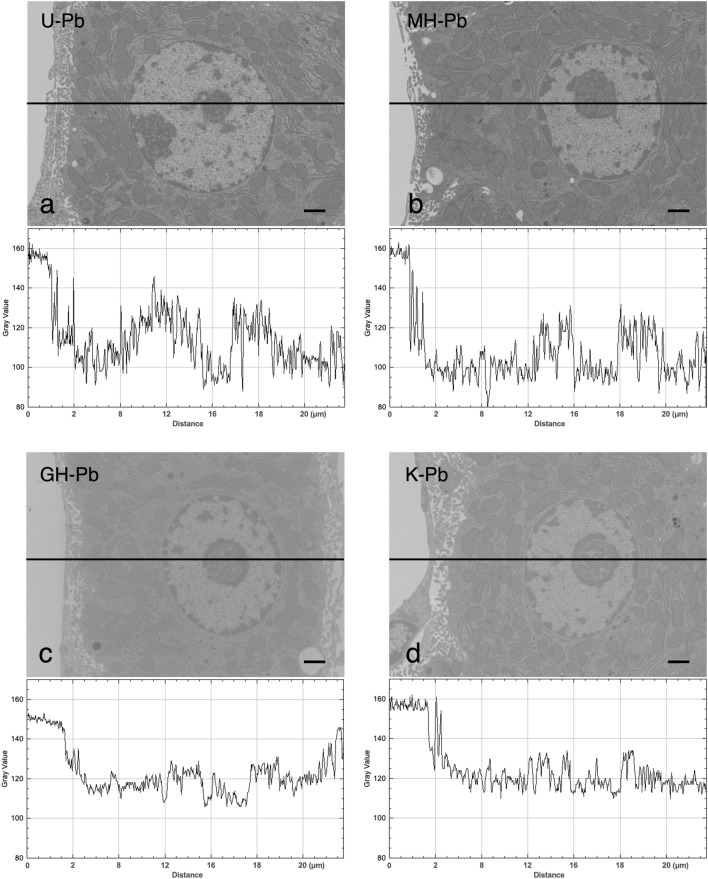
Figure 2.
Quantitative analysis of mouse hepatocytes stained with UA, MH, Gill No.3 and Kernechtrot followed by RPb. Digital images were subjected to gray-level (i.e. contrast) line analysis using ImageJ image processing software to semi-quantitatively determine image quality. The line profile displaying two-dimensional graphs of the intensities of pixels along black lines within the images. The x-axis represents distance along the line and the y-axis is the pixel gray-level intensity. The gray level of each pixel is represented by 256 gradations of gray, with pixel value 0 being black and pixel value 255 being white. (a) UA-RPb and line profile, (b) MH-RPb and line profile, (c) Gill No.3-RPb and line profile and (d) Kernechtrot-RPb and line profile. Bar = 2 μm.

