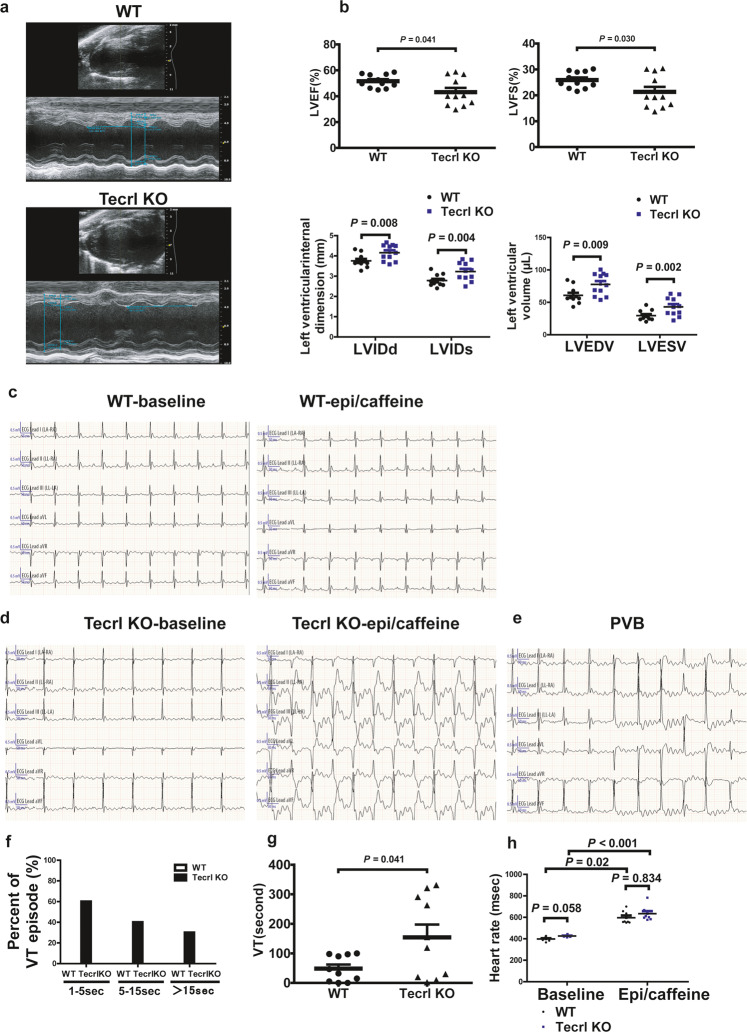
Fig. 2. Tecrl deficiency-induced cardiac dysfunction.
a Representative echocardiography images of WT and Tecrl KO mice. b Quantification of LVEF, LVFS, LVIDd, LVIDs, LVEDV, and LVESV in WT and Tecrl KO mice (8 weeks) (n = 8). c–f Representative ECG recordings and percent of VT episode (%) in WT and Tecrl KO mice before and after epi/caffeine stimulation (n = 10). g Quantification of VT (n = 10). h Quantification of mice heart rate (n = 8). Values are mean ± SE. P < 0.05 was considered significant.

