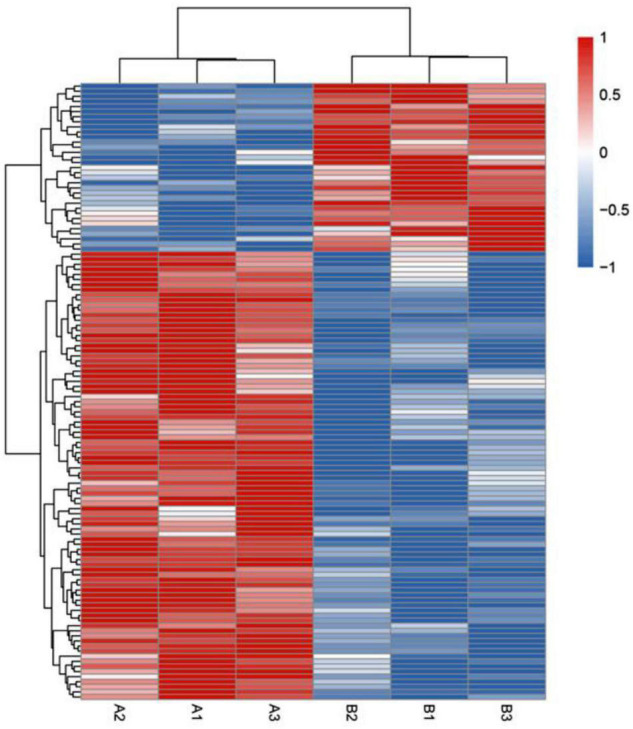
FIGURE 3.

Heatmap showing hierarchical cluster analysis of lysine-acetylated proteins in control groups (A1–A3) and exercise groups (B1–B3). The Euclidean distance was used as the distance metric, and the clustering criteria were complete. The heatmap includes an accompanying supplemental table with the list of the proteins used and their fold change (supplemental “DEP heatmap”).
