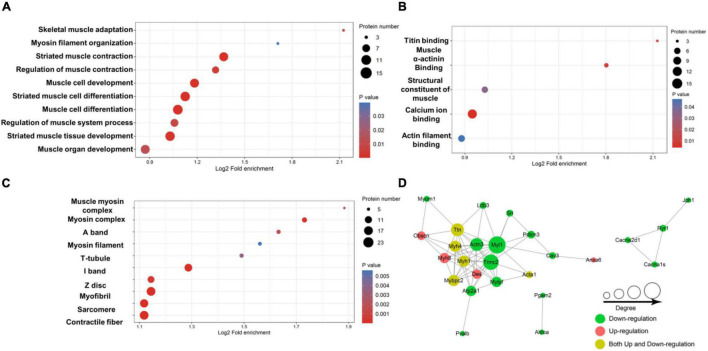
FIGURE 4.
Enrichment analysis of the lysine-acetylated proteins. Enrichment based on GO annotation in terms of biological process (A), molecular function (B), and cellular component (C). (D) Protein–protein interaction network for acetylated proteins. The nodes represent proteins, and their colors represent the upregulation or downregulation of these proteins; green means downregulation (change ratio < 0.83), red means upregulation (change ratio > 1.20), and yellow means both upregulation and downregulation. The size of each node represents the number of directed edges.

