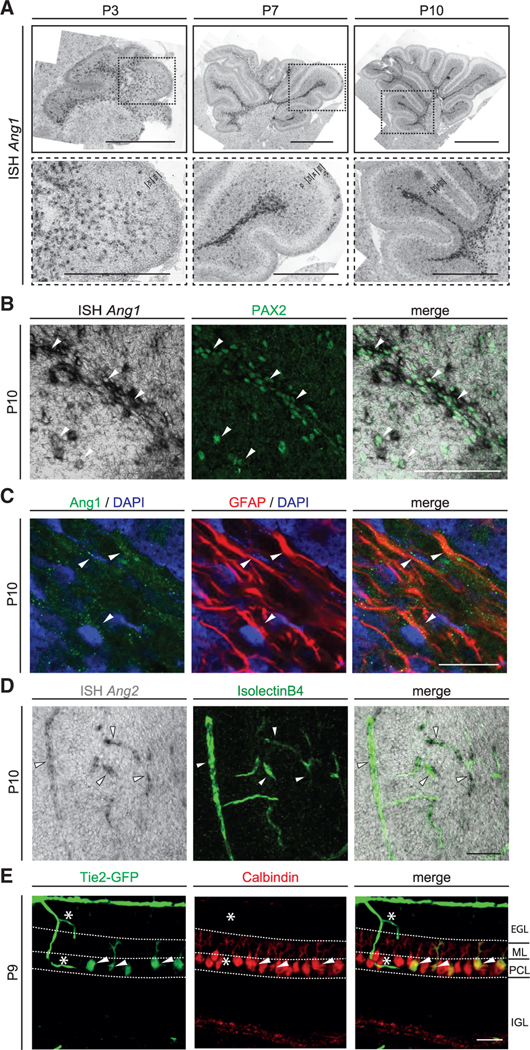
Figure 1. Ang1, Ang2, and Tie2 are expressed by distinct cell types during development of the cerebellum.
(A) ISH of Ang1 mRNA in sections of cerebellum at different postnatal stages. Bottom images show insets of the respective top image. Scale bar, 1 mm (overview) and 500 μm (higher magnification).
(B) ISH of Ang1 mRNA on P10 cerebellar tissue together with IF staining of GABAergic interneuron lineage marker PAX2.
(C) IF staining of Ang1 on P10 cerebellar tissue together with astrocyte marker GFAP and DAPI.
(D) ISH of Ang2 mRNA on P10 cerebellar tissue combined with IsolectinB4 (EC marker).
(E) Representative image of cerebellar tissue of P9 Tie2-GFP mice stained for GFP and Calbindin (PC marker).
Double-positive cells are indicated with white arrowhead in (B)–(E). Asterisks shows GFP-positive blood vessels in (E). Scale bar in (B): 100 μm, (C): 20 μm and in (D) and (E): 50 μm. See also Figure S1.

