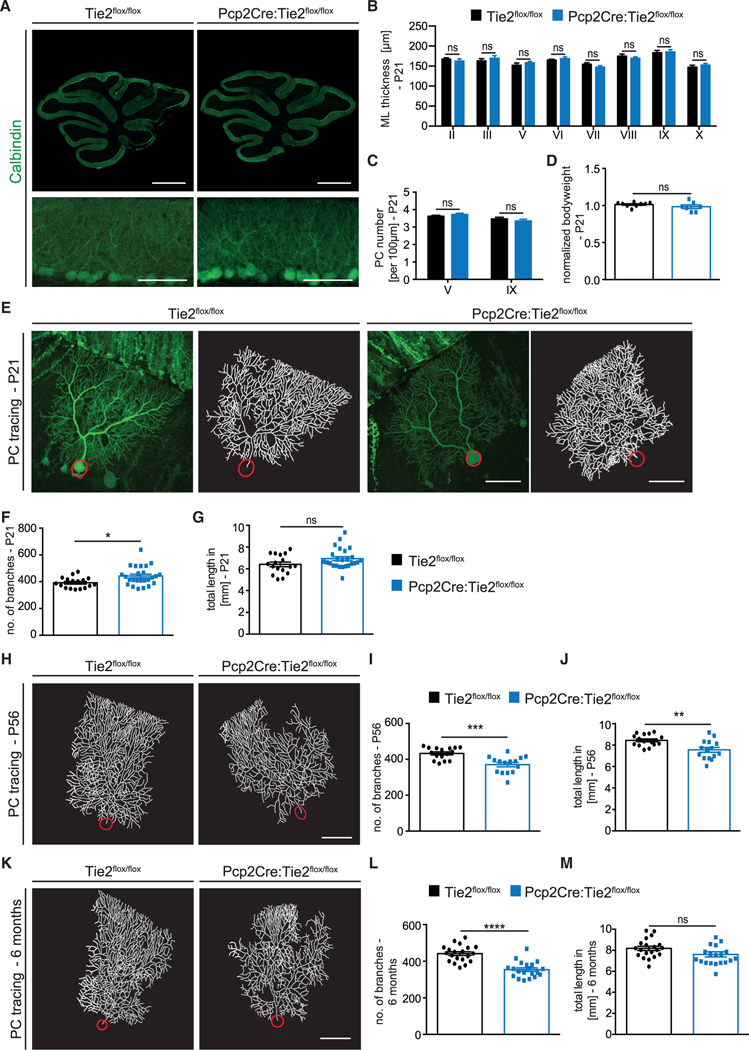
Figure 2. PC-specific deletion of Tie2 leads to a progressive reduction in PC dendritic complexity.
(A) Representative images of P21 Tie2flox/flox and Pcp2Cre:Tie2flox/flox cerebella stained with Calbindin. Scale bar, 1 mm (top panels) and 100 μm (bottom panels).
(B) Bar graph showing ML thickness at P21 in all cerebella lobes (II-X).
(C) Bar graph showing PC number per 100 μm in lobes V and IX. Data in (B) and (C) are shown as mean ± SEM from minimum n = 7 animals per genotype.
(D) Bar graph showing normalized bodyweight of Tie2flox/flox and Pcp2Cre:Tie2flox/flox P21 mice. Data are shown as mean ± SEM from a minimum of n = 7 animals.
(E) Representative images of PCs from P21 Tie2flox/flox and Pcp2Cre:Tie2flox/flox mice labeled with YFP using AAV8 (left panels) and corresponding tracing (right panels).
(F and G) Quantitation of the number of branches (F) and total dendritic length (G) at P21.
(H) Representative image of traced PCs of Tie2flox/flox and Pcp2Cre:Tie2flox/flox mice at P56.
(I and J) Quantitation of the number of branches (I) and total dendritic length (J) at P56. K) Representative image of traced PCs of Tie2flox/flox and Pcp2Cre: Tie2flox/flox mice at 6 months.
(L and M) Quantitation of the number of branches (L) and total dendritic length (M) at 6 months.
Data in (E)–(M) are shown as mean ± SEM from a minimum of n = 15 neurons of a minimum of 3 independent animals. Unpaired Student’s t test; *p < 0.05; **p < 0.01; ***p < 0.001; ****p < 0.0001; ns = not significant. Scale bar in (E), (H), and (K), 50 μm. See also Figures S3, S4, and S6.

