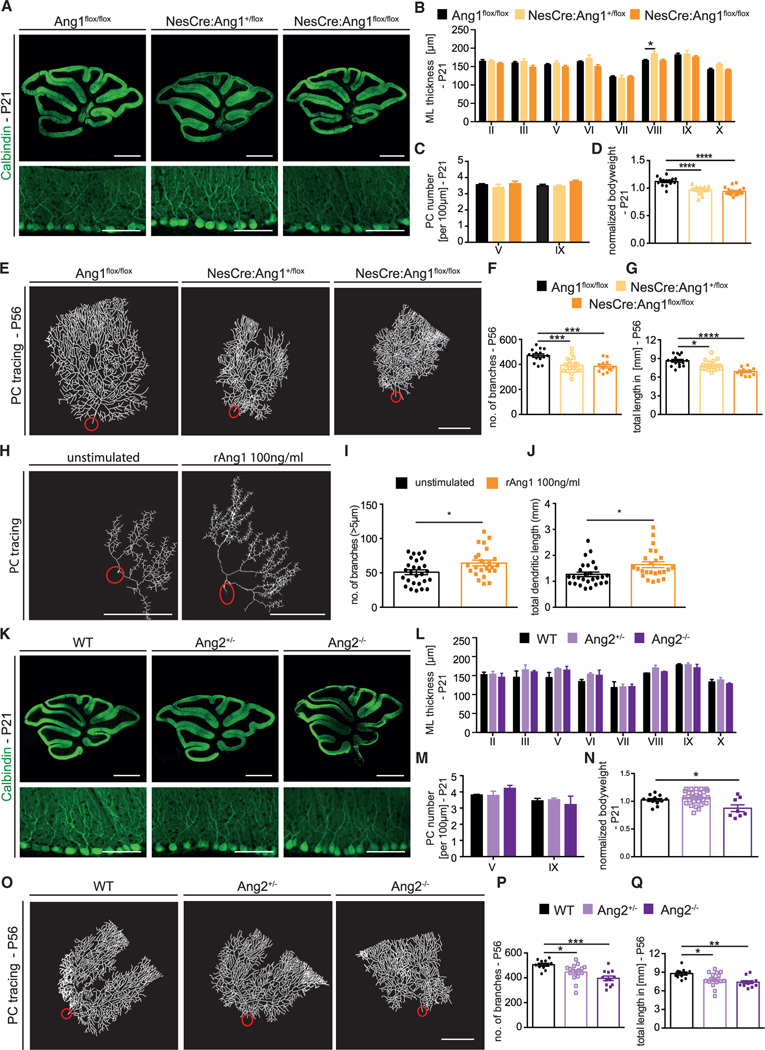
Figure 3. Mice with neural-specific deletion of Ang1 or Ang2 full knockout mice present aberrant PC dendritic morphogenesis.
(A) Representative images of P21 Ang1flox/flox, NesCre:Ang1+/flox, and NesCre:Ang1flox/flox stained with Calbindin (PC marker). Scale bar, 1 mm (top panels) and 100 μm (bottom panels).
(B) Bar graph showing ML thickness at P21 in all cerebella lobes (II–X).
(C) Bar graph showing PC number per 100 μm in lobes V and IX.
Data in (B) and (C) are shown as mean ± SEM from a minimum of n = 6 animals per genotype. Data are not significant if not indicated. One-way ANOVA for each lobe; *p < 0.05.
(D) Bar graph showing normalized bodyweight at P21 for the indicated mice. Data are represented as mean ± SEM from a minimum of n = 14 animals. One-way ANOVA; ****p < 0.0001.
(E) Representative image of traced PCs of Ang1flox/flox, NesCre:Ang1+/flox, and NesCre:Ang1flox/flox mice at P56.
(F and G) Quantitation of the number of branches and total dendritic length at P56. Data are represented as mean ± SEM from a minimum of n = 11 neurons from a minimum of 3 independent animals. One-way ANOVA; *p < 0.05; **p < 0.01; ****p < 0.0001.
(H) Representative PC traces of PCs from organotypic cerebellar slices from P6 pups stimulated with or without 100 ng/mL rAng1 over the course of 3 DIV.
(I and J) Quantitation of the number of branches and total dendritic length of PCs from cerebellar slices. Data are represented as mean ± SEM from a minimum of n = 24 neurons from a minimum of 4 independent experiments. Unpaired Student’s t test; *p < 0.05.
(K) Representative images of P21 Ang2+/− and Ang2−/− cerebella sections stained with Calbindin. Scale bar, 1 mm and 100 μm in higher magnification.
(L) Bar graph showing ML thickness at P21 in all cerebella lobes (II–X).
(M) Bar graph showing PC number per 100 μm in lobes V and IX.
Data in (L) and (M) are represented as mean ± SEM from a minimum of n = 3 animals. Data are not significant if not indicated. One-way ANOVA for each lobe.
(N) Bar graph showing normalized bodyweight at P21 for the indicated mice. Data are represented as mean ± SEM from a minimum of n = 8 animals. Data are not significant if not indicated. One-way ANOVA; *p < 0.05.
(O) Representative traced PCs of WT, Ang2+/−, and Ang2−/− mice at P56.
(P and Q) Quantitation of the number of branches and total dendritic length of WT, Ang2+/−, and Ang2−/− mice at P56.
Data are represented as mean ± SEM from a minimum of n = 11 neurons from a minimum of 3 independent animals. One-way ANOVA; *p < 0.05; **p < 0.01; ***p < 0.001. Scale bars in (E), (H), and (O), 50 μm. See also Figures S5 and S6.

