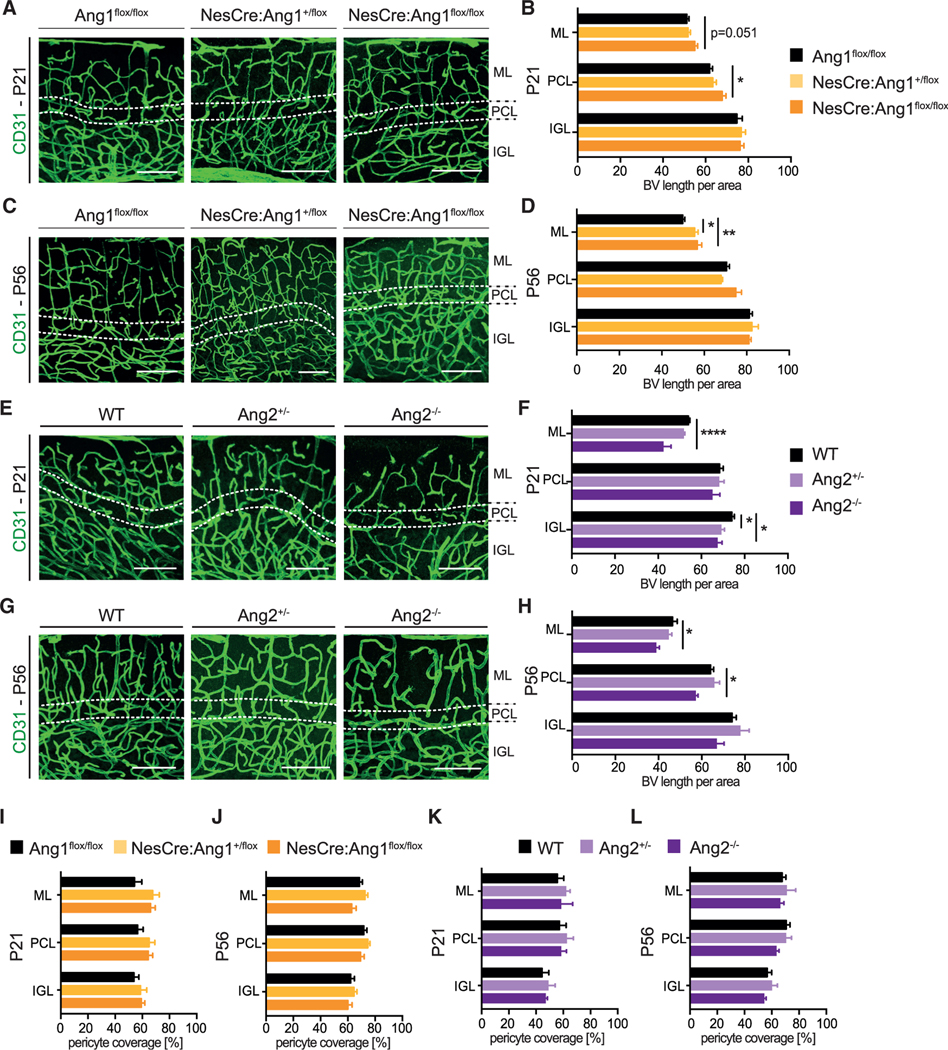
Figure 4. NesCre:Ang1flox/flox and Ang2−/− mice show mild vascular morphological defects in the cerebellum.

(A and C) Representative images of blood vessels (stained with the EC marker CD31) in the cerebellum from P21 and P56 from Ang1flox/flox, NesCre:Ang1+/flox and NesCre:Ang1flox/flox animals.
(B and D) Quantification of blood vessel length per area, for the different cerebellar layers. Data are represented as mean ± SEM from a minimum of n = 3 animals. Data are not significant if not indicated. One-way ANOVA; *p < 0.05; **p < 0.01.
(E and G) Representative images of blood vessels (stained with the EC marker CD31) in the cerebellum from P21 and P56 from WT, Ang2+/−, and Ang2−/− mice.
(F and H) Quantification of blood vessel length per area for the different cerebellar layers. Data are represented as mean ± SEM from a minimum of n = 3 animals. Data are not significant if not indicated. One-way ANOVA; *p < 0.05; ****p < 0.001. Scale bar in (A), (C), (E), and (G): 100 μm.
(I–L) Pericyte coverage of blood vessels in the cerebellum was quantified in the different cerebellar layers at P21 (I and K) and P56 (J and L) for the indicated mice. Data are represented as mean ± SEM from a minimum of n = 3 animals. Data are not significant if not indicated. One-way ANOVA.
