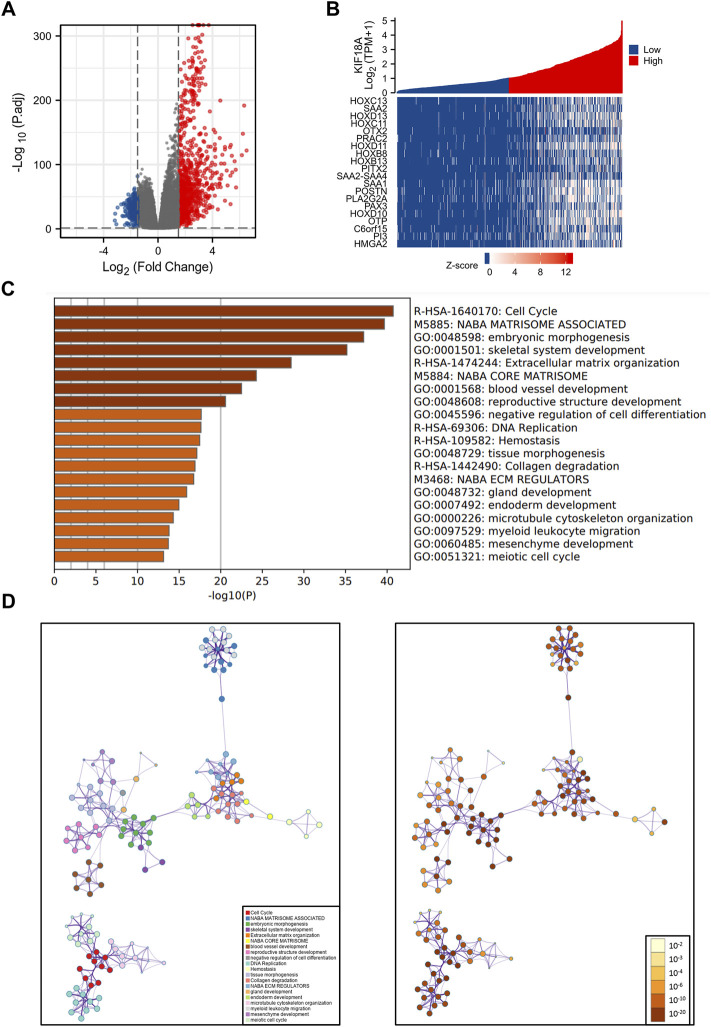
FIGURE 3.
Visualization and functional enrichment analysis of the DEGs between high and low KIF18A expression groups. (A) Volcano plot of the top DEGs. (B) Heat maps of the top 20 DEGs. (C) Bar plot of 20 most relative biological functions enriched terms. (D) Interaction network of 20 most relative biological functions.

