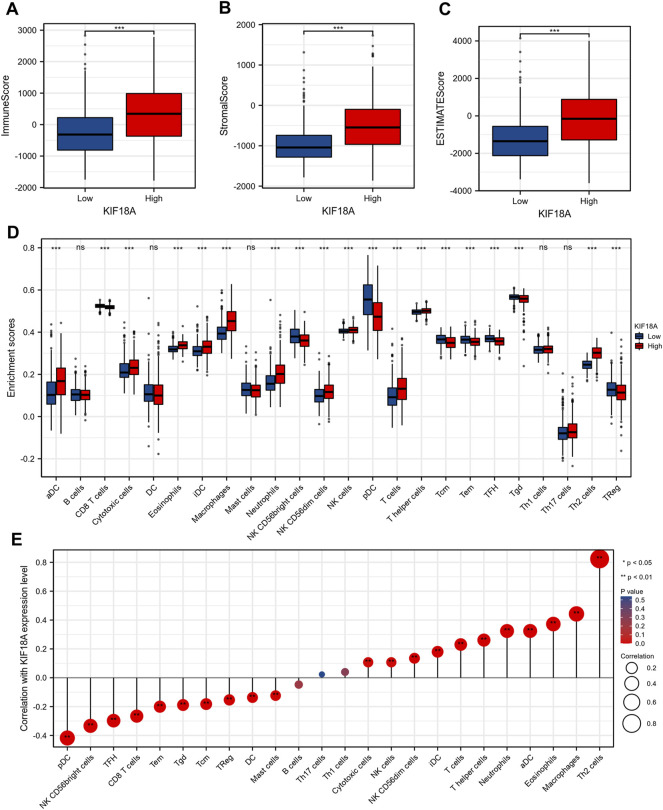
FIGURE 4.
The correlations between KIF18A mRNA expression level and immune cell infiltration. Comparison of Immune Score (A), Stromal Score (B) and ESTIMATE Score (C) between the KIF18A-high and KIF18A-low patient groups. (D) The varied proportions of 24 subtypes of immune cells in high and low KIF18A expression groups. (E) The correlations between KIF18A mRNA expression level and the infiltration of different subtypes of immune cells. (ns, p ≥ 0.05; *p < 0.05, **p < 0.01, ***p < 0.001).

