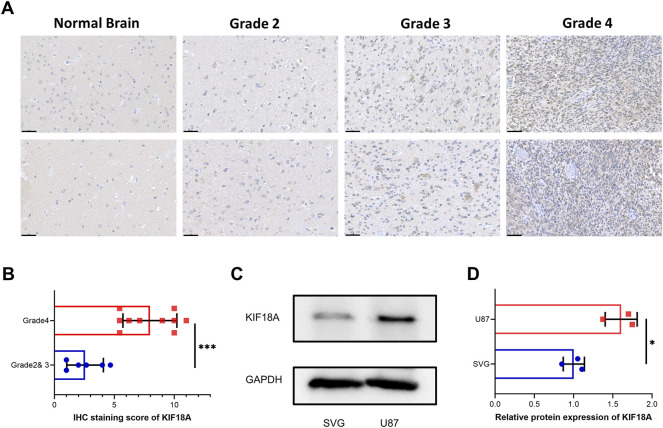
FIGURE 7.
Validation of KIF18A expression in clinical samples and cell lines. (A) Confirmation of KIF18A expression using immunohistochemical staining in normal brain and glioma tissues. Scare bars, 50 μM. (B) IHC staining score of KIF18A in glioma with different grade. (C) Examination of the expression of KIF18A in the U87 and SVG cell line by western blot. (D) Quantitative data of KIF18A in the U87 and SVG cell line. (*p < 0.05, **p < 0.01, ***p < 0.001).

