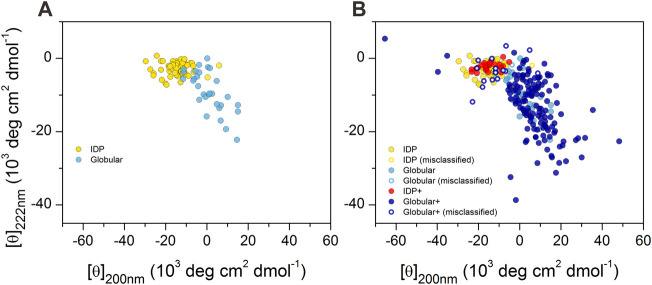
FIGURE 1.
2D-plot of CD data of IDPs and ordered proteins. (A) Mean residue ellipticities at 200 and 222 nm wavelengths for IDPs (yellow) and globular proteins (light blue) were collected from the literature for proteins previously studied by Uversky (2002), Uversky (2003), Uversky and Fink (2004). “Random coil” and “premolten globule” types of IDPs were not distinguished in our work. (B) Plot of the full reference database. IDPs over the ones presented in (A) are shown in red, while the additional globular ones are shown in dark blue. Hollow circles show those proteins that are incorrectly classified as disordered or ordered by using the 200 and 222 nm wavelength data of proteins presented in panel A as training set for disordered–ordered classification (see later). Note the large spectral (and conformational) space covered by the ordered proteins.

