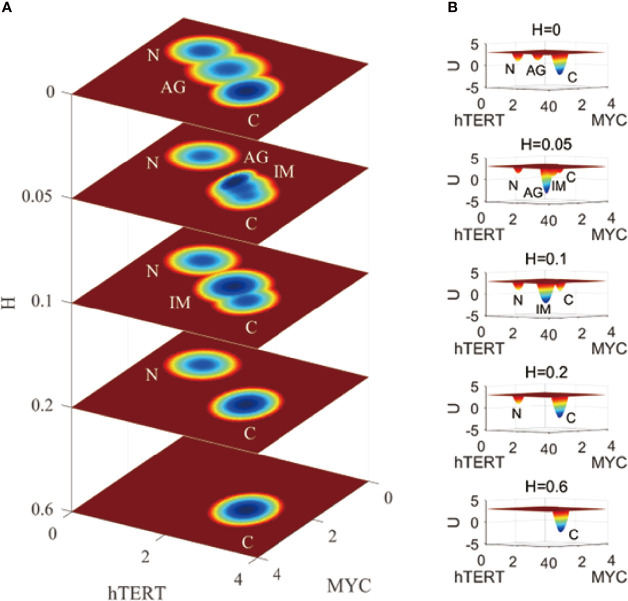
Figure 3.
A comparison of the landscape topography variations fir IGC with Helicobacter pylori infection. The X and Y-axes represent the gene expression levels of hTERT and MYC, respectively, while the Z-axis represents the variations in H. H denotes the degree of Helicobacter pylori infection. N, AG, IM, and C represent the normal, atrophic gastritis, intestinal metaplasia, and gastric cancer states, respectively. (A) is the comparison of the 2-dimensional landscape. (B) is the comparision of the 3-dimensional landscape.

