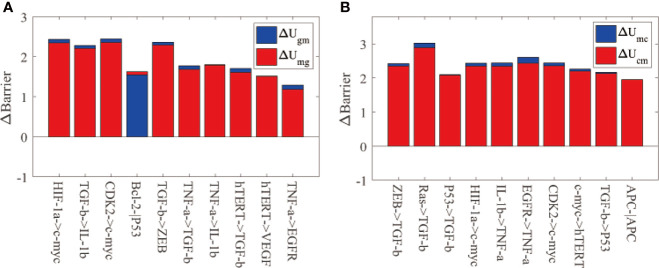
Figure 5.
The global sensitivity analysis for IGC with Helicobacter pylori infection. The meanings of the X-axis and Y-axis are the same as Figure 3 . (A) The barrier height variations between the AG and IM states. ∆Ugm represents the barrier height variation between the AG and IM states. ∆Umg is the barrier height variation between the IM and AG states. (B) The barrier height variation between the IM and cancer states. ∆Umc is the barrier height variation between the IM and cancer states. ∆Ucm is the barrier height variation between the cancer and IM states.

