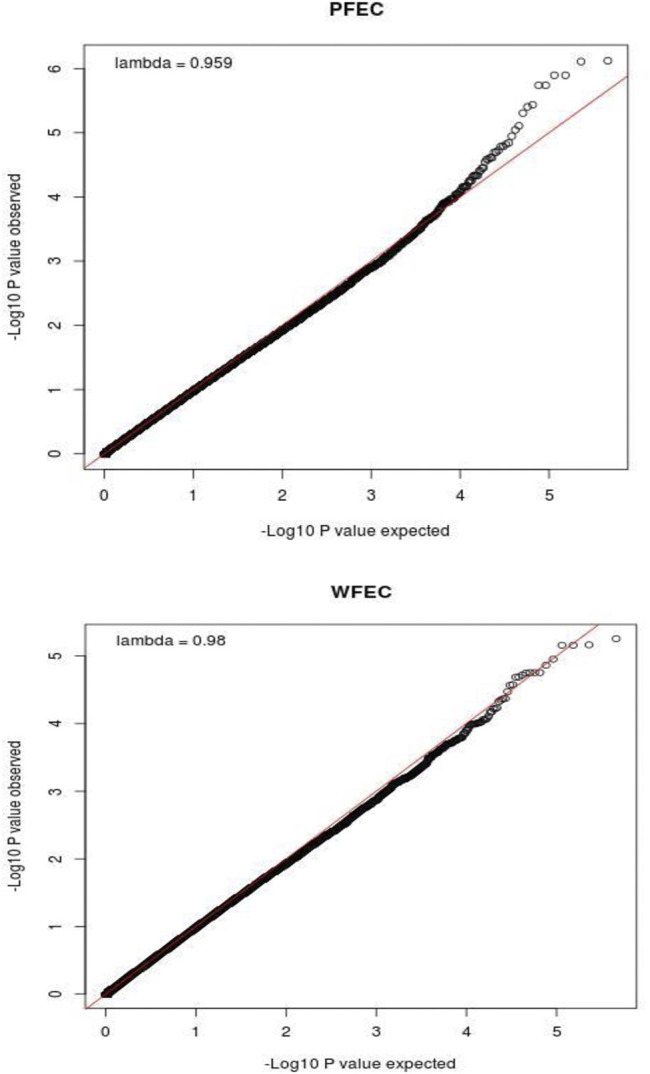
FIGURE 2.

QQ plots showing the relationship between observed and expected values for -Log10(P) for postweaning (PFEC) and weaning (WFEC) fecal egg count EBV from the single-SNP genome-wide association study using a pedigree-based relationship matrix. P is the nominal significance level for each SNP.
