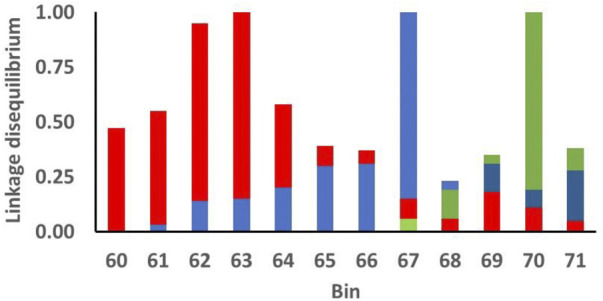
FIGURE 4.

Linkage disequilibrium (r 2) among the most significant markers for postweaning fecal egg count estimated breeding values (PFEC EBV) in each of the indicated 1-Mb bins on chromosome 5. The x-axis indicates the position (Mb) of each bin on chromosome 5. Bins originating at 63, 67, and 70 Mb contained the individual SNP markers with the most significant associations with the PFEC EBV (Figure 3). For each color, the top of the bar of that color for each bin designates the linkage disequilibrium between the most significant marker in the bin and the most significant marker in bins 63 (red), 67 (blue), and 70 (green). For example, the most significant SNP in bin 71 has LD of 0.04 with the most significant SNP in bin 63 (top of the red bar), LD of 0.28 with the most significant SNP in bin 67 (top of the blue bar), and 0.35 with the most significant SNP in bin 70 (top of the green bar).
