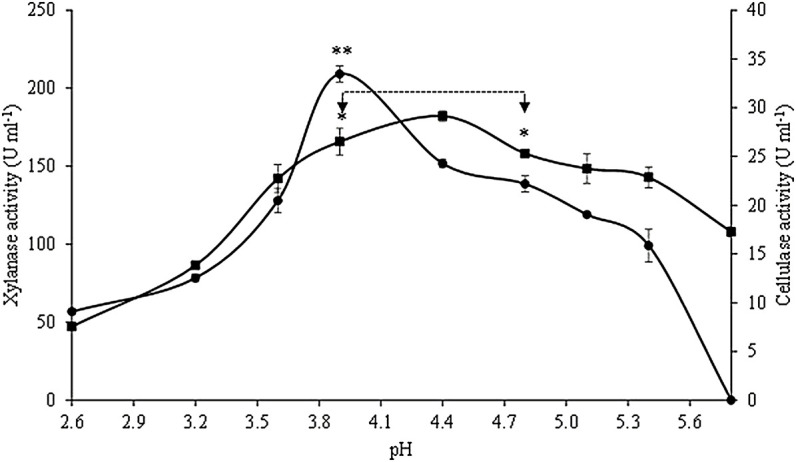
FIGURE 4.

Effect of pH on xylanase (■) and cellulase (•) activities. Asterisks represent the interval of temperatures and pH in which no statistical differences were detected (Tukey’s test, p < 0.05) for xylanase (*) and cellulase activities (**). Values are presented as the mean ± standard deviation of two independent replicates.
