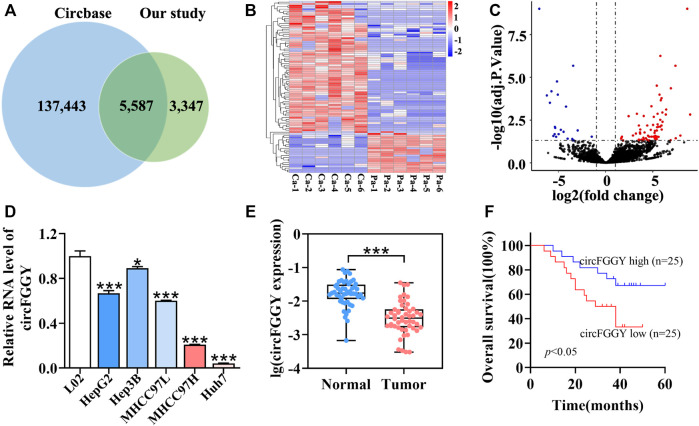
FIGURE 1.
Identification and characteristics of circFGGY. (A) Venn diagram showing the intersection between circRNAs identified in our study and circBase. (B) Clustered heatmap of the differentially expressed circRNAs in six paired HCC and adjacent normal tissues. Rows represent circRNAs while columns represent tissues. (C) Volcano plots showing the identification of circRNAs. The red color indicates upregulated genes (adj P. value < 0.05, log 2 FC > 1) and blue color indicates downregulated genes (adj P. value < 0.05, log 2 FC < -1), while black color indicates genes with no significant differences among the HCC and adjacent normal tissues. Log2 FC means that log2 transformation to fold changes of circRNA expression between HCC tissues and adjacent normal tissues. (D) qRT-PCR comparing the expression of circFGGY in various HCC cell lines and the normal liver cell line L02. One-Way ANOVA was used. Data are represented as mean ± SD, n = 3. Comparing with LO2, *: p < 0.05; ***: p < 0.001. (E) Analysis of RNA expression of circFGGY in the 50 paired HCC and adjacent normal tissues using qRT-PCR. Wilcoxon matched-pairs signed rank test was used. Data represented as median (Min, Max), n = 50. ***: p < 0.001. (F) Kaplan-Meier analysis of the association of circFGGY expression and the OS of HCC patients after hepatectomy. Log-rank test was used, n = 50.

