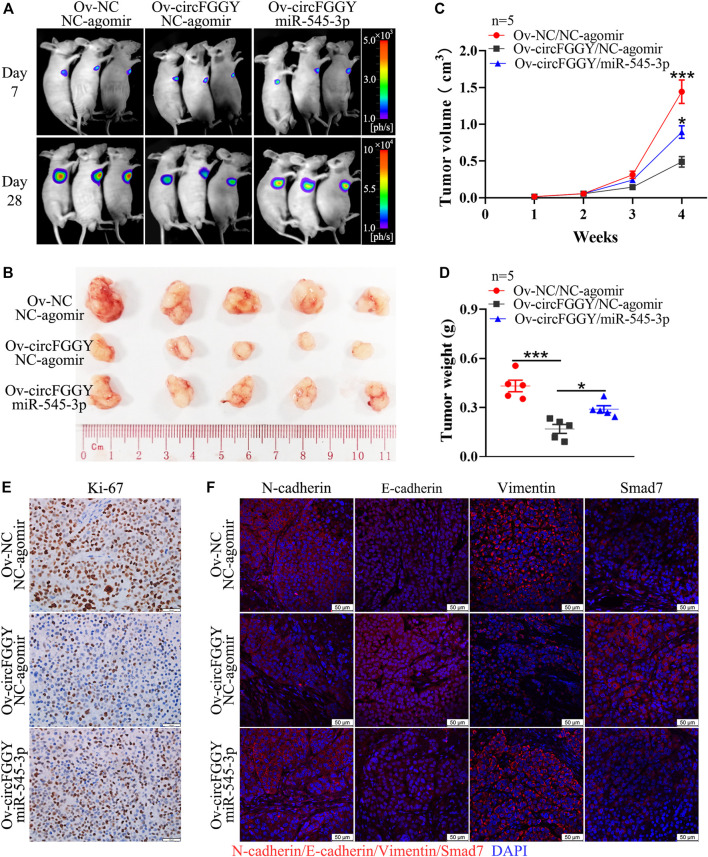
FIGURE 7.
CircFGGY inhibits the growth of HCC through the miR-545-3p/Smad7 axis in vivo. (A). Representative bioluminescence images of xenograft tumors in mice at day 7 and day 28 after injection of MHCC97H cells. (B). Representative images of the MHCC97H xenograft tumors after 4 weeks of tumor growth in circFGGY overexpression, circFGGY/miR-545-3p overexpression and NC group. (C,D) The volume and weight of subcutaneous xenograft tumors. (E) IHC analysis of Ki-67 expression in circFGGY overexpression, circFGGY/miR-545-3p overexpression and NC group. Scale bar, 50 µm. (F) Immunofluorescence (IF) analysis of EMT biomarkers and Smad7 expression in xenograft tumor tissues from the circFGGY overexpression, circFGGY/miR-545-3p overexpression and NC groups. Scale bar, 50 µm. NC group: mice were subcutaneous injected with NC-overexpressing MHCC97H cells and NC-agomir was injected around the xenograft tumor every 4 days from the second week. CircFGGY overexpression group: mice were subcutaneous injected with circFGGY-overexpressing MHCC97H cells and NC- agomir was injected around the xenograft tumor. CircFGGY/miR-545-3p overexpression group: mice were subcutaneous injected with circFGGY-overexpressing MHCC97H cells and miR-545-3p agomir was injected around the xenograft tumor. Data are presented as mean ± SEM, n = 5/group. p values were calculated by two-Way ANOVA (C) and One-Way ANOVA (D).

