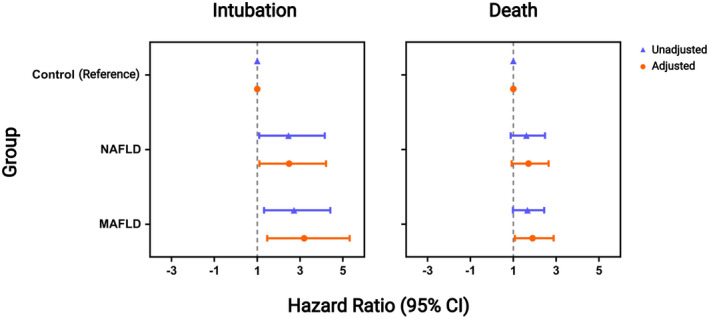
FIGURE 3.

Forest plot with the unadjusted and adjusted hazard ratios for MAFLD and NAFLD relative to the control group. Adjusted models include age, sex, and the comorbidities hypertension, type 2 diabetes, overweight, and obesity. Age was considered a continuous variable. The model for the death outcome had a global likelihood chi‐square test with p = 0.001 and global Schoenfeld residual tests chi‐square with p = 0.3. The model for the intubation outcome had a global likelihood chi‐square test with p = 0.001 and global Schoenfeld residual tests chi‐square with p = 0.8. CI, confidence interval; MAFLD, metabolic dysfunction‐associated fatty liver disease; NAFLD, nonalcoholic fatty liver disease
