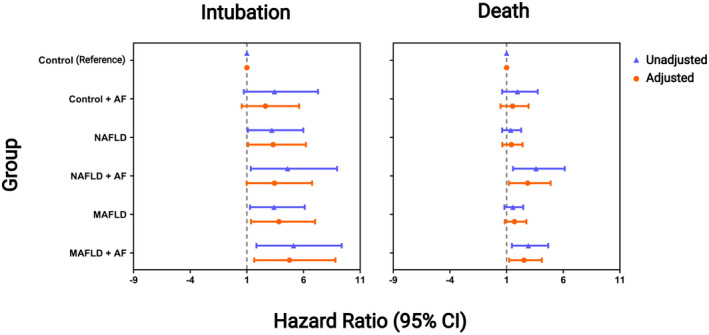
FIGURE 4.

Forest plot with the unadjusted and adjusted hazard ratios for MAFLD and NAFLD relative to the control group when groups were divided according to the presence of advanced fibrosis. Adjusted models include age, sex, and the comorbidities hypertension, type 2 diabetes, overweight, and obesity. Age was considered a continuous variable. The model for the death outcome had a global likelihood chi‐square test with p < 0.001 and global Schoenfeld residual tests chi‐square with p = 0.1. The model for the intubation outcome had a global likelihood chi‐square test with p = 0.007 and global Schoenfeld residual tests chi‐square with p = 0.8. AF, advanced fibrosis; CI, confidence interval; MAFLD, metabolic dysfunction‐associated fatty liver disease; NAFLD, nonalcoholic fatty liver disease
