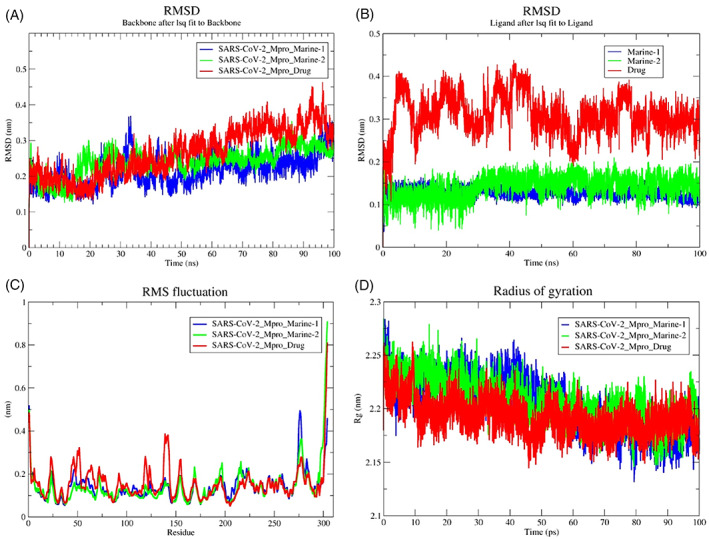
FIGURE 2.

Conformational stability of PRODGR‐derived topology files in the form of RMSD‐plots at 100 ns MD simulation in individual color plots; (A), overlayed RMDS‐plots of SARS‐CoV‐2‐Mpro‐Drug (darunavir), SARS‐CoV‐2‐Mpro‐Marine‐1 (manzamine A) and SARS‐CoV‐2‐Mpro‐Marine‐2 (8‐hydroxymanzamine); (B), overlayed RMDS‐plots of individual ligand stability in the docked complexes; (C), overlayed RMSF‐plots of SARS‐CoV‐2‐Mpro‐drug (darunavir), SARS‐CoV‐2‐Mpro‐Marine‐1 (manzamine A) and SARS‐CoV‐2‐Mpro‐Marine‐2 (8‐hydroxymanzamine) and (D), overlayed Rg‐plots of SARS‐CoV‐2‐Mpro‐Drug (darunavir), SARS‐CoV‐2‐Mpro‐Marine‐1 (manzamine A) and SARS‐CoV‐2‐Mpro‐Marine‐2 (8‐hydroxymanzamine)
