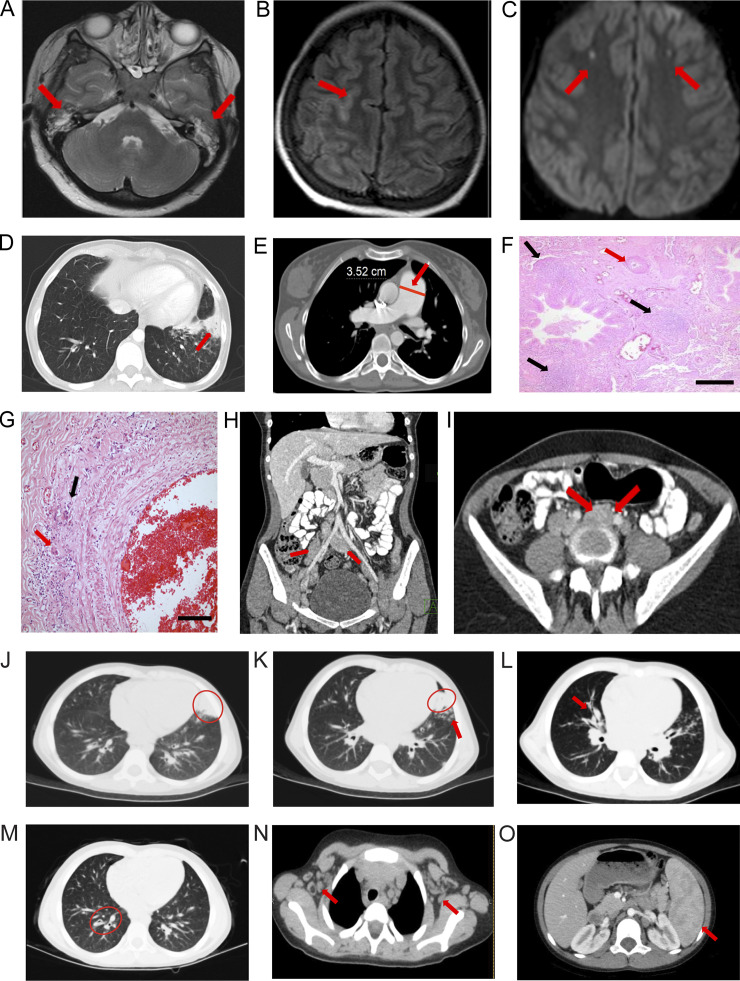
Figure 1.
Radiological and pathological findings. (A–I) Pt 1. (A) T2-weighted axial MRI slice; bilateral effusions in mastoid air cells (red arrows). (B) Axial FLAIR image and sulcal hyperintensity (red arrow). (C) Axial diffusion-weighted MRI shows diffusion-restricted lesions in both frontal lobes (red arrows). (D) Chest CT scan slices show bronchiectasis, atelectasis, and consolidation (red arrow). (E) Chest CT scan slices show pulmonary artery diameter in centimeters (red line and arrow; E). (F and G) H&E-stained lung biopsy showing mononuclear cell reaction with follicle formation around bronchioles (black arrows; F) and intimal thickening causing lumen narrowing of the pulmonary artery (red arrow; F); scale bar = 200 µm (F). Higher magnification of inflammatory infiltrate with histiocytic giant cells in the tunica adventitia (red arrow, G) and destruction of the external elastic layer (black arrow; G); scale bar = 50 µm (G). (H) Coronal abdominal CT showing para-aortic and iliac nodes (red arrows). (I) Abdominal MRI illustrating a para-aortic nodes (red arrows). (J–O) Pt. 2. Chest CT shows (J) a lingular consolidation (red oval), (K) bibasilar bronchial wall thickening and bronchiectasis (red oval and red arrow), (L) right peribronchial consolidation (red arrow), (M) mild bronchiectasis (red oval), (N) bilateral axillary adenopathy (red arrows), and (O) splenomegaly (red arrow).

