Figure 2.
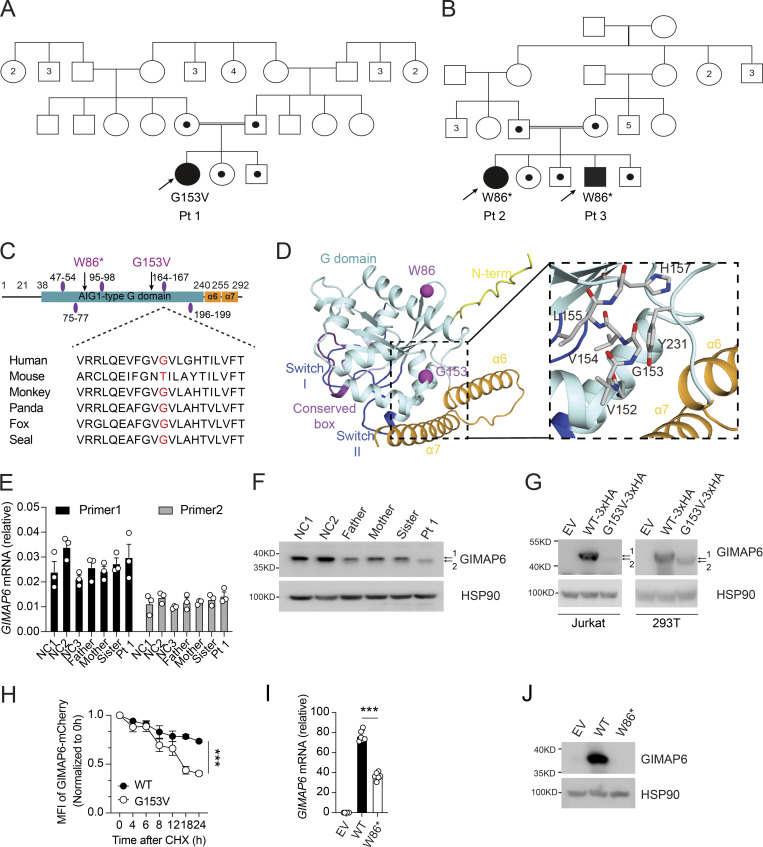
Two kindreds with deleterious mutations in GIMAP6. (A and B) Pedigrees of GIMAP6 genotypes. Open symbols: unknown or WT genotype, dots: heterozygotes, and solid symbols: homozygous genotypes in affected individuals; double line indicates consanguinity. Numbers in symbols show additional same sex siblings. Arrows indicate probands. (C) GIMAP6 protein showing the avrRpt2 induced gene 1 (AIG1)–type guanine nucleotide-binding (G) domain (cyan box) with amino acid changes (arrows) and GTP-binding motifs (purple ovals; Krucken et al., 2004). Below is a sequence alignment showing glycine residue (red) conservation. (D) AlphaFold 2 model of human GIMAP6, featuring the G domain, the P-loop (light blue), switches I and II (dark blue), residues of the conserved box involved in dimerization (magenta), helices α6 and α7 (orange), and part of the disordered N-terminus (yellow). The G153V and W86* mutations are indicated (purple). Magnified area shows the amino acids surrounding G153, which locates to a short connecting helix. (E) GIMAP6 mRNA levels in Pt 1, family members, and healthy donors (NC) using two primer sets. (F) WB of T cell lysates from Pt 1, family members, and healthy donors (NC) showing GIMAP6 and HSP90 (loading control). 1 = WT; 2 = mutant. (G) WBs of Jurkat cells transduced with empty vector (EV), GIMAP6WT (WT-3xHA), or GIMAP6G153V (G153V-3xHA) and HEK293T cells transfected with empty vector (EV), HA-tagged GIMAP6WT (WT-3xHA), or HA-tagged GIMAP6G153V (G153V-3xHA) and probed for GIMAP6 and HSP90 (loading control). 1 = WT; 2 = mutant. (H) CHX assay using HEK293T cells stably expressing mCherry-tagged GIMAP6WT (WT) or mCherry-tagged GIMAP6G153V (G153V). The mCherry signal was normalized to 0 h to calculate the protein degradation ratio. ***, P < 0.001 (two-way ANOVA with the Geisser-Greenhouse correction). (I) GIMAP6 mRNA in HEK293T cells transduced with empty vector (EV), GIMAP6WT (WT), or GIMAP6W86* (W86*). ***, P < 0.001 (unpaired Student’s t test). (J) WBs of GIMAP6 and HSP90 (loading control) of HEK293T cells transduced with EV, WT, or W86*. Bars (E, H, and I) represent mean ± SEM. Data represent two (E) or three experiments (F–J).

