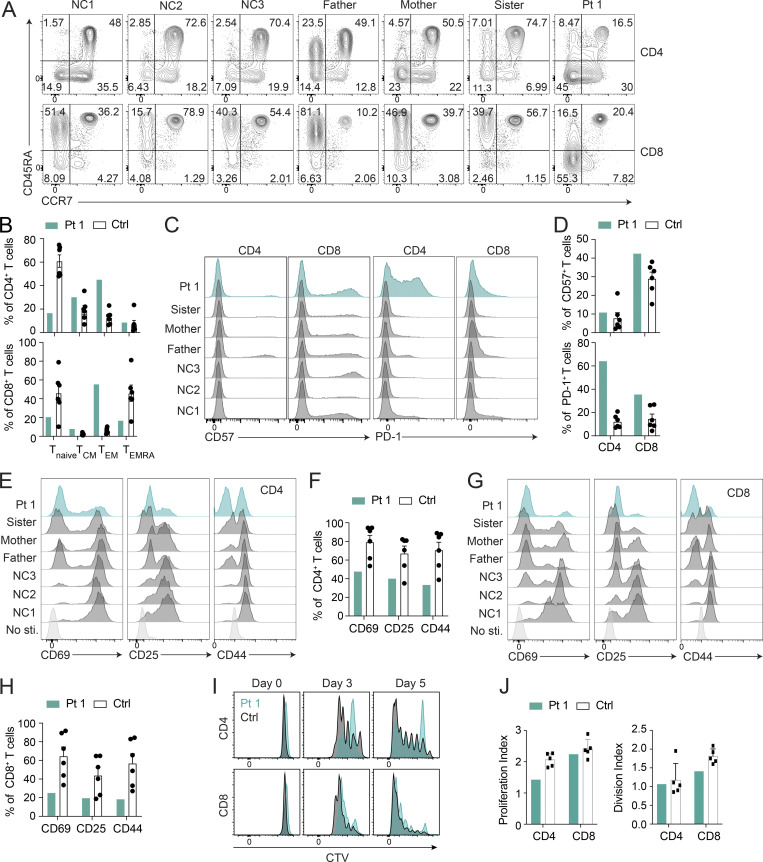
Figure 4.
Pt 1 lymphocyte surface phenotype and proliferation. (A) Flow cytometry plots of Pt 1, family, and NC samples showing naive (CCR7+CD45RA+), TCM (CCR7+CD45RA−), TEM (CCR7−CD45RA−), and effector memory re-expressing CD45RA (TEMRA; CCR7−CD45RA+) CD4+ and CD8+ T cells. (B) Quantification of A. Shown is one of two independent repeats and each dot is a different donor. (C) Flow cytometry showing CD57 and PD-1 expression on CD4+ and CD8+ T cells. (D) Quantification of C. Shown is one of two independent repeats and each dot is a different donor. (E and G) Flow cytometry showing CD69, CD25, and CD44 expression on CD4+ and CD8+ T cells after PBMCs were stimulated with 5 µg/ml each of plate-bound anti-CD3/CD28 for 24 h. (F) Quantification of E. (H) Quantification of G. Shown is one of two independent repeats. (I) Flow cytometry showing Cell Trace Violet (CTV) proliferation of CD4+ and CD8+ T cells stimulated with 1 µg/ml each of anti-CD3/CD28 for the indicated days. (J) Quantification of I. Bars (B, D, F, H, and J) represent mean ± SEM. Shown is one of two experiments, and each dot or square (n = 5−6) is a different donor in B, D, F, H, and J.

