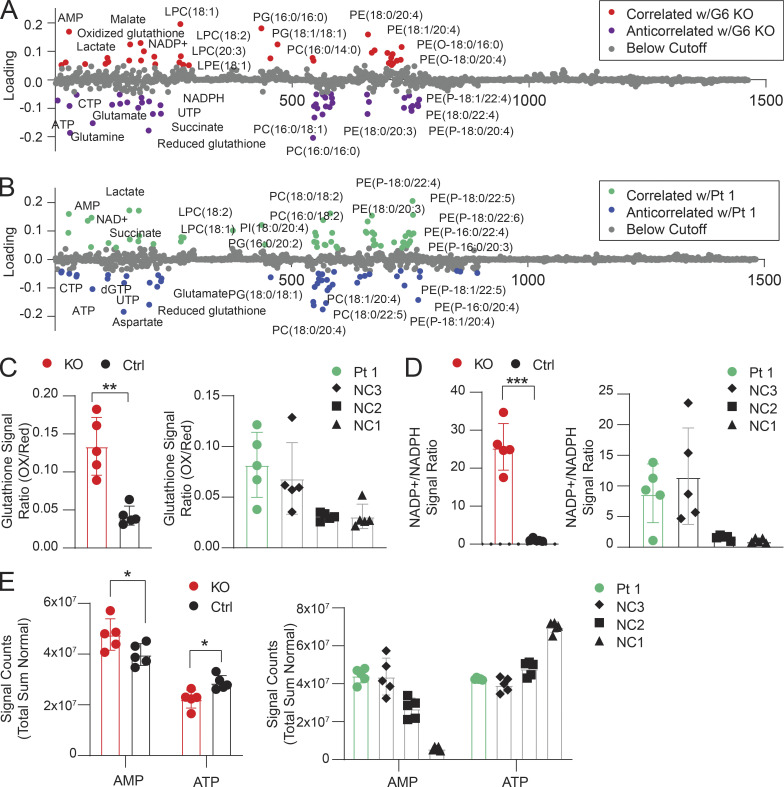
Figure 5.
Metabolic and lipidomic changes in Pt 1 T cells and GIMAP6-deficient Jurkat cells. (A) PLS-DA of molecular correlates (red) and anticorrelates (purple) of GIMAP6-deficient (G6 KO) and WT Jurkat T cells. (B) Pt 1 T cells compared to control T cells. Features with loading scores >20% of maximum were colored as correlated (green) or anticorrelated (blue) with GIMAP6 deficiency. LPE, lysophosphatidylethanolamine; LPC, lysophosphatidylcholine; PG, phosphoglycerol; PC, phosphotidylcholine; PE, phosphotidylethanolamine. (C) Ratios of the signals of oxidized to reduced glutathione. (D) Ratio of the normalized signals of oxidized to reduced NADPH. (E) Total sum normalized signals for AMP and ATP. n = 5 for all groups. Bars (C–E) represent mean ± SD. Data represent three experiments (A–E). An unpaired t-test was used for C–E (*, P < 0.05; **, P < 0.01; ***, P < 0.001).

