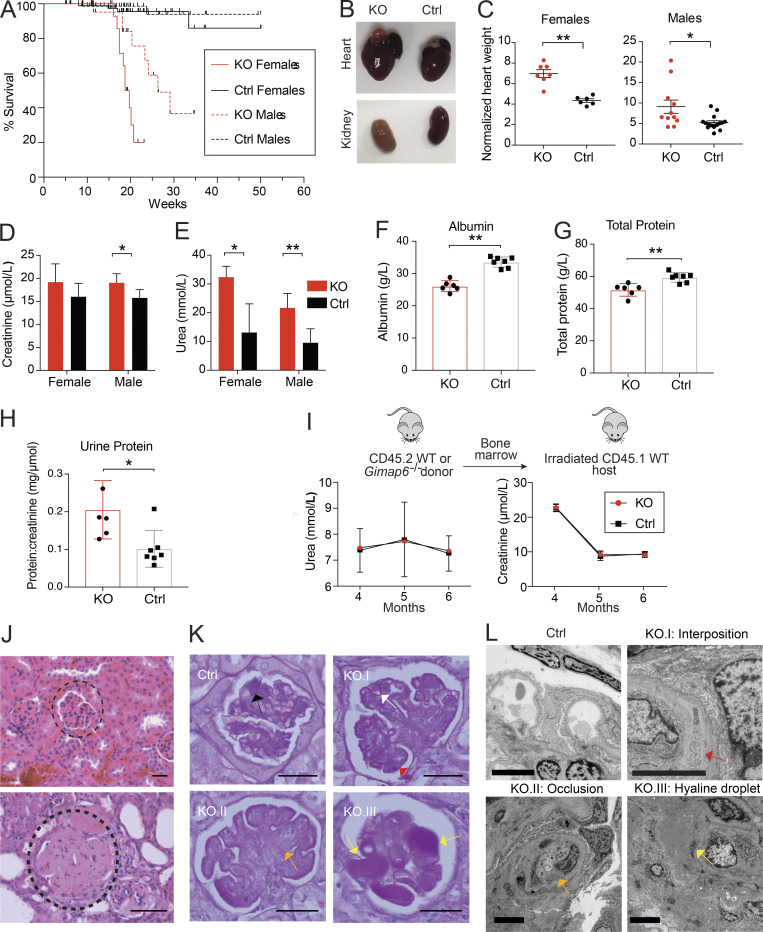
Figure 6.
Gimap6−/− mice have reduced survival due to microangiopathic renal disease. (A) Kaplan-Meier survival curve in Gimap6−/− (KO) and controls (Ctrl) pooled from WT and heterozygous mice. Culled mice were censored at death. nKO females = 33; nKO males = 35; nControl females = 99; nControl males = 80. Females: P < 0.0001; Males: P < 0.0005 (log-rank Mantel-Cox test). (B) Gross anatomy of hearts (upper) and kidneys (lower) in KO and Ctrl mice. (C) Normalized heart weight (mg heart/g body weight) in females (mean ± SEM, left, nKO = 6; nControl = 6) and males (right, nKO = 11; nControl = 15). (D) Plasma creatinine in 9–10-wk-old mice. mean ± SD, nKO Female = 5; nControl Female = 6; nControl Male = 8; nKO male = 8. (E) Plasma urea in 9–10-wk-old mice. mean ± SD, nKO Female = 5; nControl Female = 6; nControl Male = 8; nKO male = 8. (F) Serum albumin in 9–10-wk-old mice. mean ± SD, nKO = 6; nControl = 7. (G) Total protein in 9–10-wk-old mice. mean ± SD, nKO = 6; nControl = 7. (H) Urine protein in 9–10-wk-old mice (mean ± SD, nKO = 5; nControl = 7). (I) Bone marrow from CD45.2 Gimap6−/− (KO) or littermate controls was transferred to lethally irradiated CD45.1 WT mice. Top: Experimental scheme. Bottom: Plasma urea and creatinine after transfer (mean ± SD; n = 10 for both groups). (J) Photomicrographs (400×) of H&E-stained sections from Ctrl (top) and KO mouse (bottom) kidneys. Dotted curve encircles a glomerulus. Shown is one of three experiments. Scale bar = 20 μm. (K) Photomicrographs of glomeruli with PAS staining. Ctrl shows normal mesangium (black arrow). KO.I shows glomerular capillary wall thickening (white arrow) and duplication (red arrow). KO.II shows mesangiolysis (orange arrow). KO.III shows glomerular hyaline deposits (yellow arrows). nKO = 7; nControl = 5. Scale bar = 20 μm. (L) Representative transmission electron microscopy images of glomeruli from Ctrl and KO mice. Ctrl shows a normal glomerulus. KO.I shows cellular interposition (red arrow) between the basement membranes. KO.II shows capillary lumen occlusion (orange arrow). KO.III shows hyaline droplets (yellow arrows). nKO = 3; nControl = 1. Scale bar = 5 μm. An unpaired t-test was used for C–H (*, P < 0.05; **, P < 0.01).

