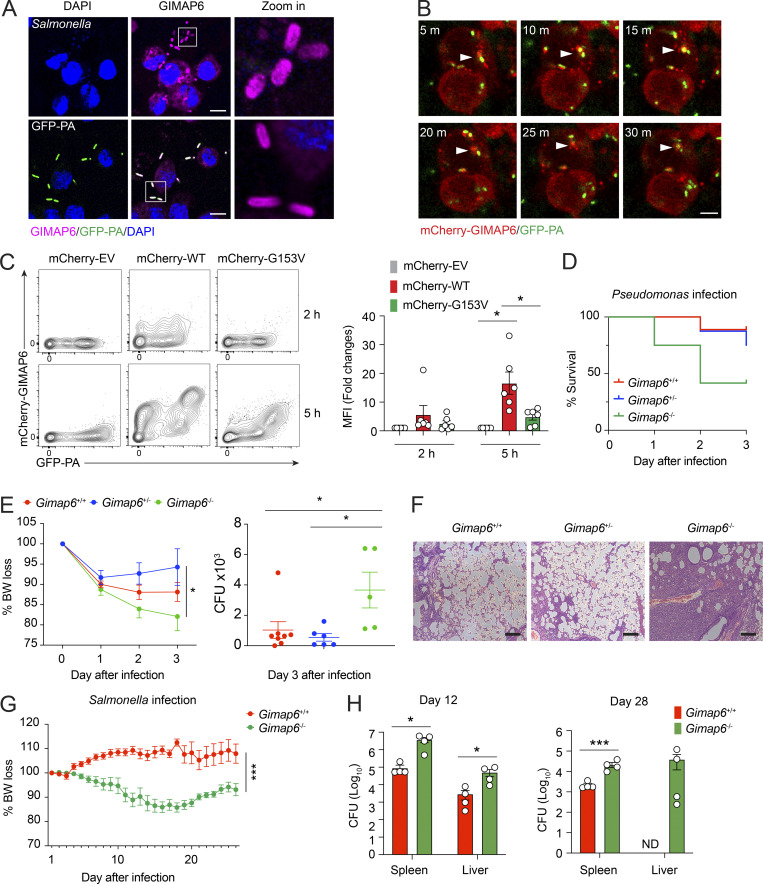
Figure 8.
GIMAP6 co-localizes with pathogenic bacteria and plays a role in antibacterial activity. (A) Confocal photomicrographs of immunostaining GIMAP6 and Salmonella (upper panel) or GFP-Pseudomonas (GFP-PA; lower panel) in differentiated THP-1 cells. Zoom in (right) is a 6× enlargement of the boxed region. Scale bar, 10 μm. Shown is one of three experiments. (B) Time-lapsed live cell confocal microscopy imaging of mCherry-tagged GIMAP6 (mCherry-GIMAP6) and GFP-PA in THP-1 differentiated macrophages. Images taken at 5 min (m) intervals. Arrow shows double-stained bacteria. Scale bar, 5 μm. Shown is one of two experiments. (C) Flow cytometry analysis of mCherry-GIMAP6 and GFP-PA in THP-1 differentiated macrophages transduced with WT or G153V mCherry-GIMAP6 lentivirus after infection with GFP-PA at 2 or 5 h. Statistics for mCherry-GIMAP6 MFI on GFP-PA (right). Data are pooled from three experiments. An unpaired t-test was used (*, P < 0.05). (D) Percentage of mouse survival after P. aeruginosa infection. Data are pooled from two out of three experiments. Gimap6+/−, n = 8; Gimap6+/+, n = 9; Gimap6−/−, n = 12. (E) Average body weight loss (BW loss %; left panel) and quantified CFUs of P. aeruginosa bacteria extracted from total lung tissue from surviving mice on day 3 after infection (right panel) of the same experiment. Gimap6+/−, n = 8; Gimap6+/+, n = 9; Gimap6−/−, n = 12. *, P < 0.05 (two-way ANOVA with the Geisser–Greenhouse correction). Data are pooled from two out of three experiments. (F) Photomicrographs of H&E-stained lung sections from WT and Gimap6−/− mice on day 3 following infection with 5 × 10⁸ CFU of P. aeruginosa. Scale bar, 100 μm. Shown is one of three experiments. (G and H) Average body weight loss (BW loss %; G) and CFUs of Salmonella bacteria extracted from total spleen and liver tissues (H) of infected WT and Gimap6−/− mice. Gimap6+/−, n = 8; Gimap6−/−, n = 8. ***, P < 0.001 (two-way ANOVA with the Geisser-Greenhouse correction) in G. Gimap6+/−, n = 4; Gimap6−/−, n = 4. *, P < 0.05, ***, P < 0.001 (an unpaired t-test) in H. Bars (C, E, G, and H) represent mean ± SEM. Data represent three experiments.

