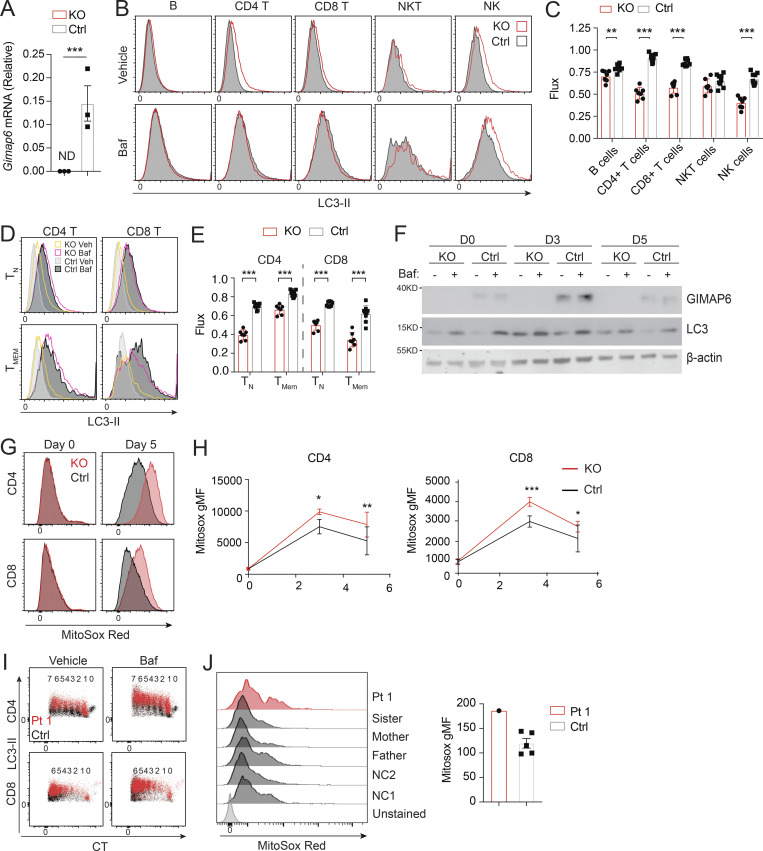
Figure S2.
Defective autophagy in Gimap6−/− lymphocytes. (A) Quantitative PCR analysis of Gimap6 mRNA expression in T cells isolated from WT (Ctrl) and Gimap6−/− (KO) mice. ND, not detectable. Data represent three experiments. (B and C) Whole splenocytes from WT (Ctrl) and Gimap6−/− (KO) mice were treated with 100 nM Baf or an equal volume of vehicle (100% ethanol, Veh) for 2 h and then intracytoplasmically stained with antibody against LC3. (B) Representative flow plots of splenocytes gating on B cells (B220+), CD4 T cells (CD3+CD4+), CD8 T cells (CD3+CD8+), NK cells (NK.1+CD3−), and NKT cells (NK1.1+CD3+). (C) Quantification of autophagic flux (gMFI LC3Baf − gMFI LC3Veh)/gMFI LC3Veh. nKO = 7; nCtrl = 9. Data represent three experiments. (D) Representative flow plots showing LC3-II levels in naive (TN; CD44−) or memory (TMEM; CD44+) CD4 or CD8 T cells. (E) Autophagic flux as calculated in D. nKO = 7; nCtrl = 9. Data represent three experiments. (F) WB of enriched CD4 T cells activated for the indicated number of days (D) with 1 µg/ml of plate bound anti-CD3 and anti-CD28. On the day of harvest, cells were incubated for 2 h with vehicle (100% ethanol) or 10 nM Baf and then lysed in radioimmunoprecipitation assay buffer. Lysates were run on Bis-Tris gels and transferred onto PVDF membranes before immunoblotting with antibodies against mouse GIMAP6, LC3, and β-actin. Cells from one to three mice were pooled for each experiment. Shown is one representative experiment of three. (G and H) Whole mouse splenocytes were activated for 3 or 5 d with 1 µg/ml plate bound anti-CD3 and soluble anti-CD28 before staining with MitoSox Red for 15 min. (G) Representative flow plots showing MitoSox Red staining of CD4 and CD8 T cells. (H) Quantification of G. nKO = 4; nCtrl = 11. Shown is one of two experiments. (I) Representative flow plot showing LC3-II staining in proliferating Pt 1 and control (Ctrl) T cells activated for 3 d. The number of divisions each population has undergone is shown above, as indicated by dilution of CTV. Data represent three experiments. (J) Purified T cells from controls (Ctrl, including two NC and family members) and Pt 1 were activated for 15 d with Dynabeads Human T-Activator CD3/CD28 before staining with MitoSox Red for 15 min. Flow plots showing MitoSox Red staining (left) and quantification (right). Data represent three experiments. An unpaired t-test was used for A, C, E, and H (*, P < 0.05; **, P < 0.01; ***, P < 0.001). Bars (A, C, E, H, and J) represent mean ± SEM.

