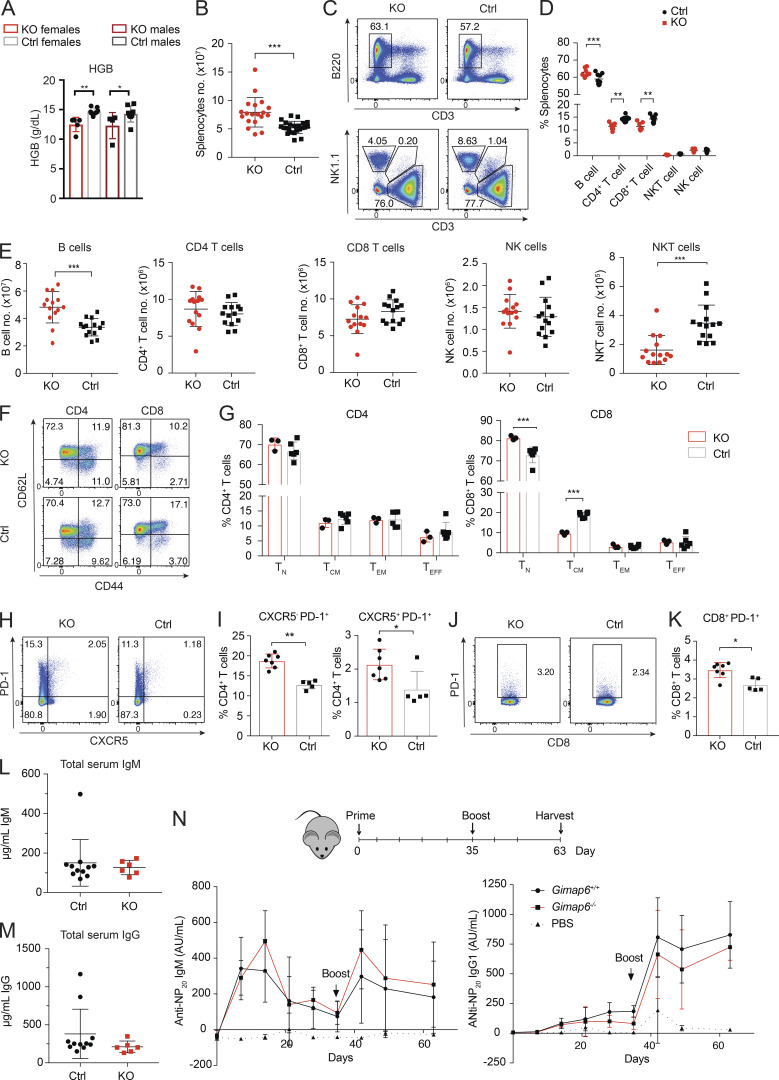
Figure S4.
Mouse immunophenotyping. (A) Whole blood was analyzed from 4-mo-old males and females using either the Pentraes 60 or Sysmex instruments and measured for hemoglobin content (HGB). nKO Female = 5; nControl Female = 7; nControl Male = 4; nKO male = 8. One of three experiments is shown. *, P < 0.05; **, P < 0.01. P values were calculated with an unpaired t-test. (B) Total splenocyte numbers of Gimap6−/− and control mouse. nKO = 19; nControl = 23. Three experiments were pooled. ***, P < 0.001. P values were calculated with an unpaired t-test. (C) Representative flow plots of B (B220+), NK (NK1.1+), T (CD3+), and NKT (NK1.1+/CD3+) splenocyte fractions from KO and control mice. nKO = 3; nControl = 6. One of three experiments is shown. (D and E) Quantitation of C for cell fraction (D) or for absolute cell count (E). Three experiments were pooled. (D) nKO = 7; nControl = 9. (E) nKO = 14; nControl = 14. **, P < 0.01; ***, P < 0.001. Mann-Whitney U test. (F) Flow cytometry dot plots of naive (TN; CD62L+CD44−), TCM (CD62L+CD44+), TEM (CD62L−CD44+), and effector (TEFF; CD62L−CD44+) CD4+ and CD8+ T cells. One of three experiments is shown. (G) Quantification of naive and memory populations in F. nKO = 3; nControl = 6. ***, P < 0.001. P values were calculated with an unpaired t-test. (H) CXCR5 and PD-1 expression in CD4+ T cells. One of three experiments is shown. (I) Quantification of H. nKO = 7; nControl = 5. *, P < 0.05; **, P < 0.01. Mann-Whitney U test. (J) PD-1 expression in CD8 T cells. One of three experiments is shown. (K) Quantification of J. nKO = 7; nControl = 5. *, P < 0.05. Mann-Whitney U test. (L and M) Total serum IgM (L) and total serum IgG (M) were analyzed by ELISA. nKO = 6; nControl = 11. (N) Mice were injected intraperitoneally with 50 µg NP-CGG in PBS 1:1 with Imject alum adjuvant and boosted 35 d later. PBS with alum was a negative control. Serum was analyzed for NP-specific IgM and IgG1 antibodies using an ELISA. Graphs show mean ± SD. AU, arbitrary units; NP, 4-Hydroxy-3-nitrophenylacetyl; NP-CGG, NP-chicken gamma globulin. nPBS = 3; nKO = 4; nControl = 8. One of two experiments is shown. Bars (A, B, D, E, G, I, K, and L–N) represent mean ± SD.

