Figure S5.
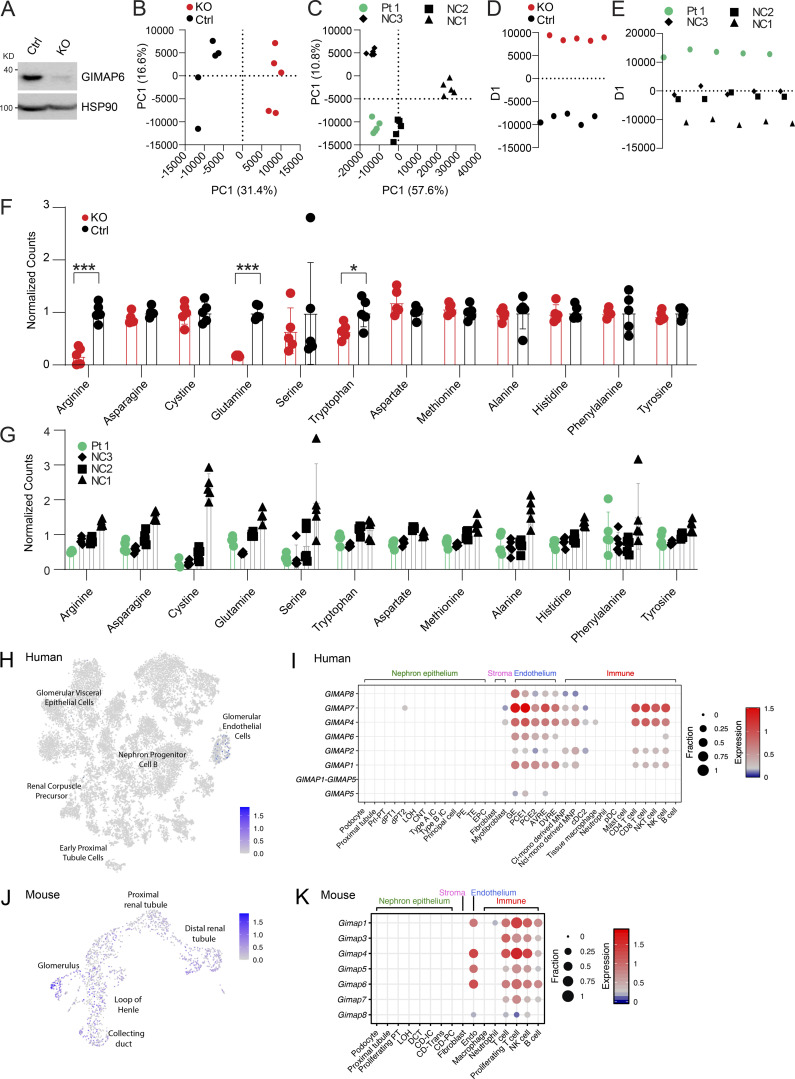
Metabolite and lipid study, and kidney specific scRNA analyses. (A) WB analysis of GIMAP6 and HSP90 (control) protein expression in Cas9 stable expressing Jurkat cells treated with control (Ctrl) and GIMAP6 (KO) sgRNA. Shown is one of three experiments. (B–E) Multivariate analysis of metabolomic and lipidomic data separates Pt 1 and GIMAP6 KO samples from controls. (B) Unbiased PCA of the combined metabolomic and lipidomic datasets for Jurkat KO and Ctrl samples. PCA utilized nine principal components to account for variance and the first two components are shown. Percentage represents the percent variance accounted for by that component. (C) PCA analysis of Pt 1 and NC samples. 19 principal components were generated of which the first two are shown. (D) PLS-DA of the Jurkat dataset separated on a single axis of variance. (E) PLS-DA of the Pt 1 dataset with NC samples grouped together to identify features correlated with Pt 1 samples. All analysis was performed in MarkerView. (F and G) Signal levels of specific amino acids in both the KO Jurkat model and Pt 1 cells. (F) Normalized amino acid signals from targeted LCMS/MS analysis of metabolites from GIMAP6 KO and control (Ctrl) Jurkat cells. All levels are normalized to the mean of the control set for display. Bars represent mean ± SD. (G) Normalized amino acid signals for Pt 1 and NCs. All levels are normalized to the mean signal across all normal controls. Bars represent mean ± SD. (H) t-SNE showing GIMAP6 expression in 20,425 human kidney cells obtained from a previously described study (Hochane et al., 2019). (I) scRNA-seq of human kidney was obtained from a previously described study (Young et al., 2018). The expression of GIMAP family genes in the indicated cell populations are shown. Dot size (fraction) shows the percentage of GIMAP-expressing cells, and color scale bar (expression) shows the expression intensity. (J) UMAP projection showing Gimap6 expression in murine kidney cells obtained from 10x Genomics. (K) scRNA-seq of mouse kidney was obtained from a previously described study (Park et al., 2018). The expression of Gimap family genes in the indicated cell populations are shown. Dot size (fraction) shows the percentage of Gimap-expressing cells, and color scale bar (expression) shows the expression intensity. Data represent three experiments (B–G). P values were calculated with an unpaired t-test in F (*, P < 0.05; ***, P < 0.001).

