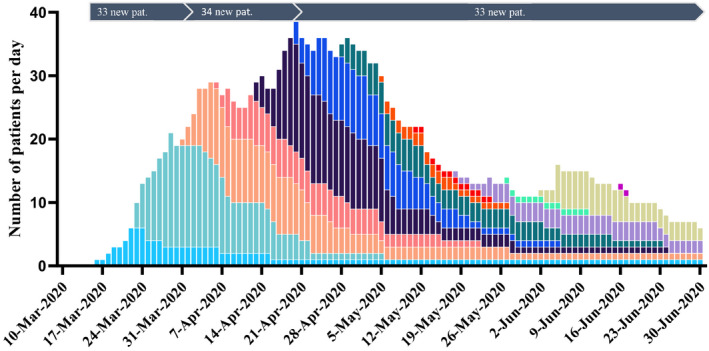
FIGURE 6.

Number per day of ICU‐treated patients with confirmed COVID‐19 in Region Östergötland, one of 21 healthcare regions in Sweden, during the early COVID‐19 pandemic 2020. Each color correlates to the patients admitted to ICU during the same week and the color curve follows their total stay in ICU. Mean increase in the number of COVID‐19 patients treated per day in the ICU was 1.5 in the first tertile, 0.6 in the second tertile and negative (declining) in the third tertile, n = 100
