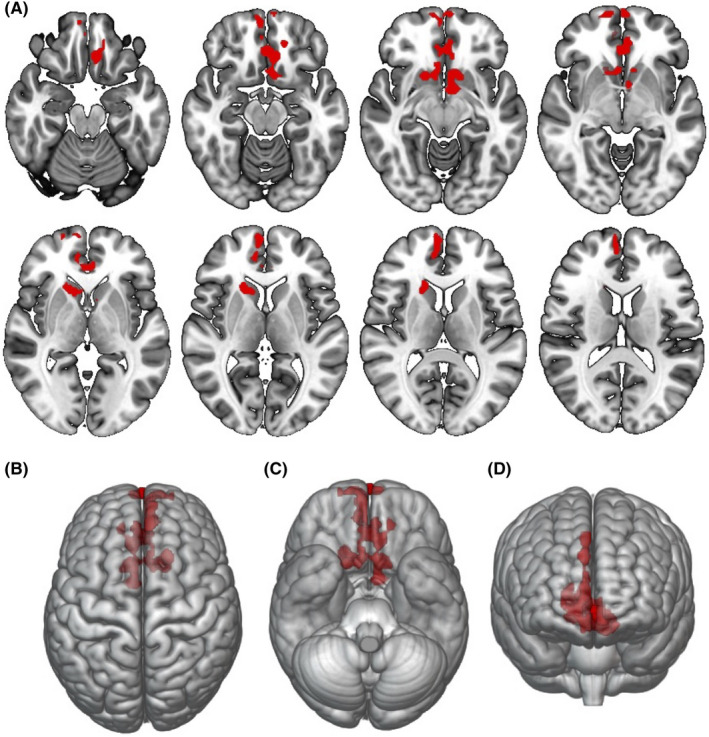
FIGURE 2.

ASL voxel‐based analysis. Multiple regression showing brain regions associated with olfactory test score in red, using age and sex as nuisance covariates (p < .01, FWE cluster‐based corrected p < .05). (A) axial view. (B–D) surface‐rendered projections. Images are shown in radiological orientation. FWE, family‐wise error
