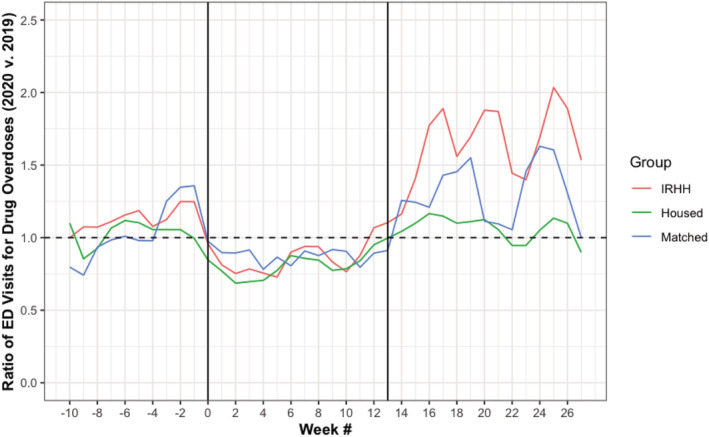
FIGURE 1.

Weekly rate ratios of emergency department visits for drug overdoses by group (2020 vs 2019). Weeks −10, 0, and 27 refer to the weeks of January 5, March 15, and September 20 in 2020, respectively. The first vertical line marks the end of the pre‐pandemic period and beginning of the peak period. The second vertical line marks the end of the peak period and beginning of the re‐opening period. IRHH = individuals with a recent history of homelessness
