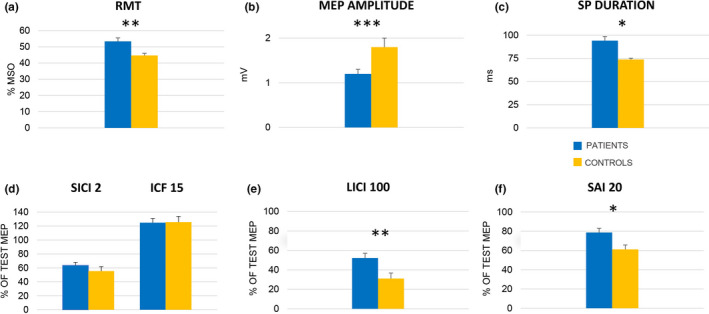
FIGURE 1.

Neurophysiological results for patients (blue) and healthy controls (yellow). (a) Measures of M1 excitability. The columns represent group mean (n = 67) resting motor threshold (RMT) expressed as a percentage of maximum stimulator output (MSO). (b) The columns represent group means (n = 58) of the peak‐to‐peak amplitude of motor evoked potentials (MEP) at rest expressed in mV. (c) The columns represent group means (n = 58) of cortical silent period duration (SP) expressed in ms. (d)–(f) Results of paired‐pulse TMS protocols testing different intracortical circuits. In all sub‐sections, the columns represent the mean amplitude (n = 58) of conditioned MEPs expressed as a percentage of the corresponding mean unconditioned (test) response. (d) SICI 2, i.e., short‐interval intracortical inhibition at 2 ms interstimulus interval (ISI), and ICF 15, i.e., intracortical facilitation at ISI 15 ms; SICI and ICF are depicted in the same graph because they belong to the same test paradigm (see text). (e) LICI 100, i.e., long‐interval intracortical inhibition at ISI 100 ms. (f) SAI 20, i.e., short‐latency afferent inhibition at the latency of individual N20 + 0 ms. Whiskers represent standard error. *p < 0.05, **p < 0.01, ***p <0.001 [Colour figure can be viewed at wileyonlinelibrary.com]
