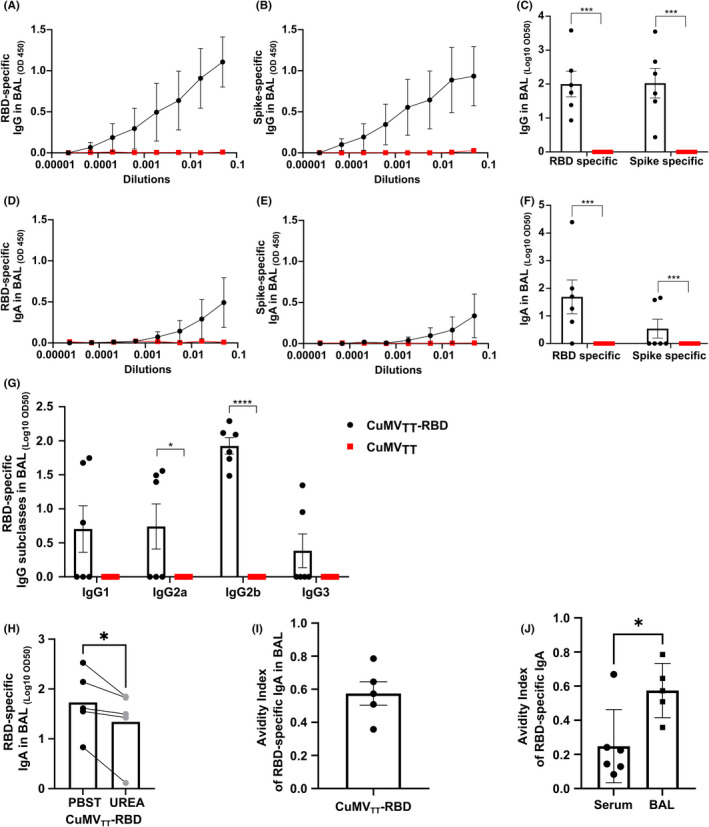
FIGURE 5.

RBD‐ and spike‐specific IgG and IgA were detected locally in BAL, with RBD‐specific IgG2b dominating the local subclass response (A–C) RBD‐ (A, C) and spike‐ (B, C) specific IgG titer in BAL for the groups vaccinated with CuMVTT‐RBD vaccine or CuMVTT control, measured by ELISA, OD450 shown in A, B, LOG10 OD50 shown in C. (D–F) RBD‐ (D, F) and spike‐ (E, F) specific IgA titer in BAL for the groups vaccinated with CuMVTT‐RBD vaccine or CuMVTT control, measured by ELISA, OD450 shown in D, E, LOG10 OD50 shown in F. (G) RBD‐specific IgG1, IgG2a, IgG2b, and IgG3 titer in BAL for the groups vaccinated with CuMVTT‐RBD vaccine or CuMVTT control, measured by ELISA, LOG10 OD50 shown. (H) RBD‐specific IgA titer in BAL from mice immunized with CuMVTT‐RBD vaccine, LOG10 OD50 shown. Plates in duplicates: treated with PBSTween or 7 M urea. (I) Avidity index of RBD‐specific IgA titer. (J) Avidity indexes of RBD‐specific IgA Abs found in BAL and serum after CuMVTT‐RBD immunization. Statistical analysis (mean ± SEM) using Student's t‐test. Control group n = 6, vaccine group n = 6. One representative of 2 similar experiments is shown
