FIGURE 1.

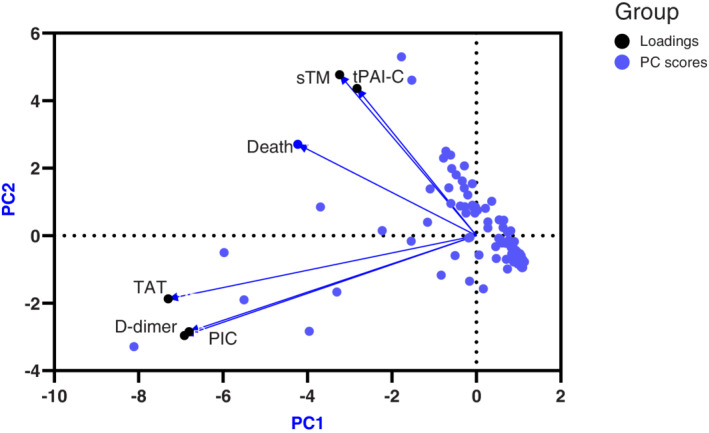
Principal component analysis of sTM, tPAI‐C, TAT, D‐dimer and PIC. Principal component scores are represented in blue and loadings in black

Principal component analysis of sTM, tPAI‐C, TAT, D‐dimer and PIC. Principal component scores are represented in blue and loadings in black