
FIGURE 5.
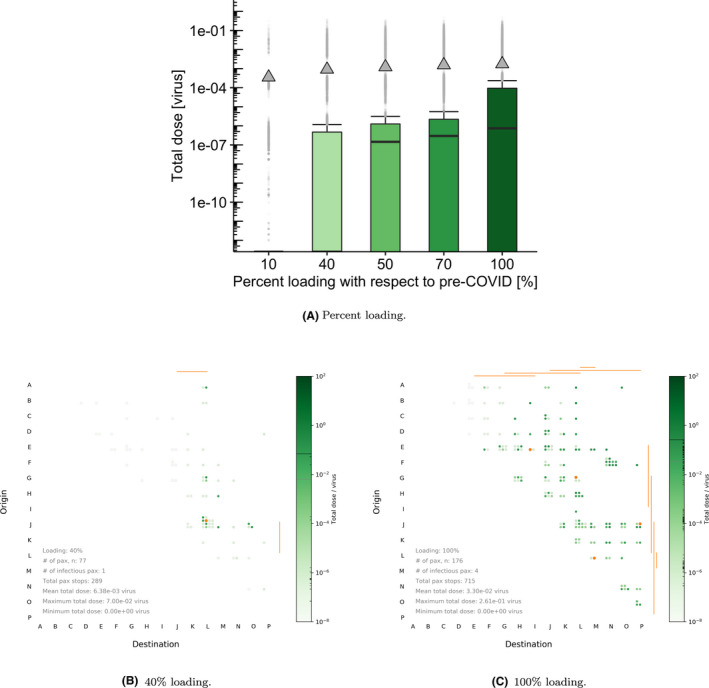
(A) Boxplots of total dose received for the BLO model and default parameter values in Table 2. (B, C) Waffle plots comparing the effect of different passenger loading () levels with respect to pre‐COVID‐19 numbers. For the waffle plots, and for illustrative purposes, we select 127 ACh–1 , 2% prevalence, and 0% mask‐wearing compliance