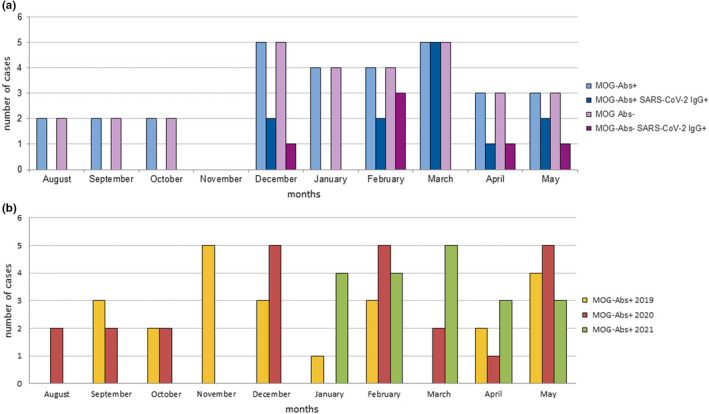
FIGURE 1.

Distribution of anti‐myelin oligodendrocyte glycoprotein antibody (MOG‐Ab)‐positive patients in the last 3 years with a focus on SARS‐CoV‐2 serostatus (August 2020 to May 2021). (a) Monthly distribution of MOG‐Abs‐seropositive (light blue) and ‐seronegative patients (light purple) referred to our tertiary center between August 2020 and May 2021 in comparison with SARS‐CoV‐2 serostatus (blue and purple, respectively). (b) Newly diagnosed MOG‐associated disorder (MOGAD) cases per month (August to May) during the last 3 years [Colour figure can be viewed at wileyonlinelibrary.com]
