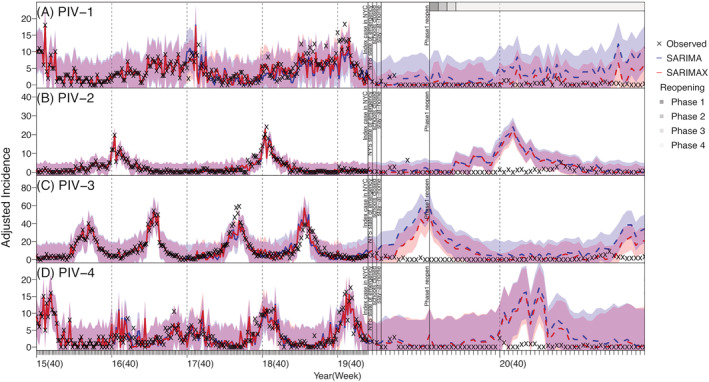
FIGURE 3.

Model fit and counterfactual‐estimates of weekly incidence for parainfluenza viruses: PIV‐1 (A), PIV‐2 (B), PIV‐3 (C), and PIV‐4 (D) using SARIMA and SARIMAX models. Blue lines (mean) and shaded areas (95% confidence intervals) show model fit (solid lines) and counterfactual‐estimates (dashed lines) using the SARIMA models; red lines (mean) and shaded areas (95% confidence intervals) show model fit (solid lines) and counterfactual‐estimates (dashed lines) using the SARIMAX models. Vertical dashed lines indicate the start of each respiratory virus season, and vertical black lines mark timing of major COVID‐19 events; gray bars on the top of the plot indicate different reopening phases in NYC. (see criteria of reopening and phases at https://forward.ny.gov). Note the x‐axis scale for the pandemic counterfactual‐estimates is expanded to show more details
