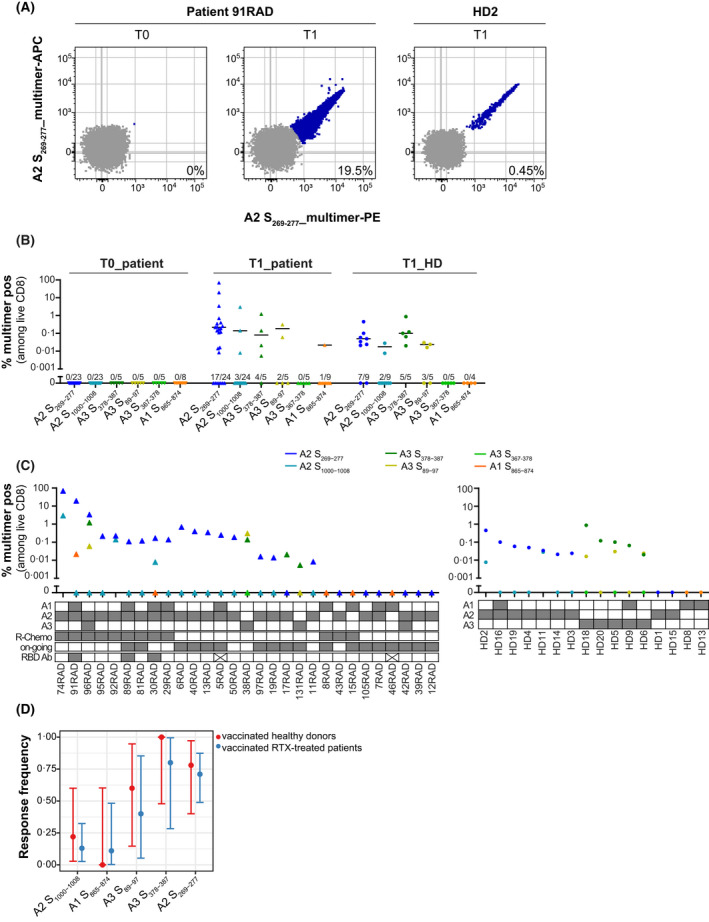
FIGURE 3.

T‐cell responses in vaccinated healthy donors (HD) and patients. (A) Epitope S269‐277 induces responses of high magnitude in vaccinated individuals after in vitro stimulation. Flow plots show peptide‐HLA (pHLA)‐multimer staining for rituximab (RTX)‐treated patient 91RAD before (T0) and after (T1) vaccination (second strongest responder among RTX‐treated patients) and the HD2 after vaccination (T1; strongest responder among HD controls). (B) Magnitude of CD8 T‐cell responses to six SARS‐CoV‐2 Spike‐specific peptides in RTX‐treated patients and HD. T‐cell responses were determined by pHLA‐multimer staining in HLA‐typed individuals (individual data points with median of responders). ● HD (T1: 3–7 weeks after vaccination; n = 16); Δ RTX‐treated patients (T0: before vaccination, n = 27; T1: 3–6 weeks after vaccination, n = 29). For each peptide the number of responses identified among the number of individuals tested is displayed above the x‐axis. (C) Response distribution among patients after vaccination (T1; left) and HD (T1; right). In the table below the graph, HLA‐type is displayed for each individual. For patients, the treatment regimen (R‐Chemo or not), treatment status (on‐going or completed), and receptor‐binding domain (RBD)‐immunoglobulin G (IgG)‐antibody response (x means no antibody data available) is displayed. (D) Immuno‐prevalence data with exact binomial 95% confidence intervals for every studied epitope in the HD (red) and patient (blue) cohort (Fisher’s exact test p > 0.5). A1, A2 and A3 refer to HLA‐A*01:01, HLA‐A*02:01 and HLA‐A*03:01 respectively
