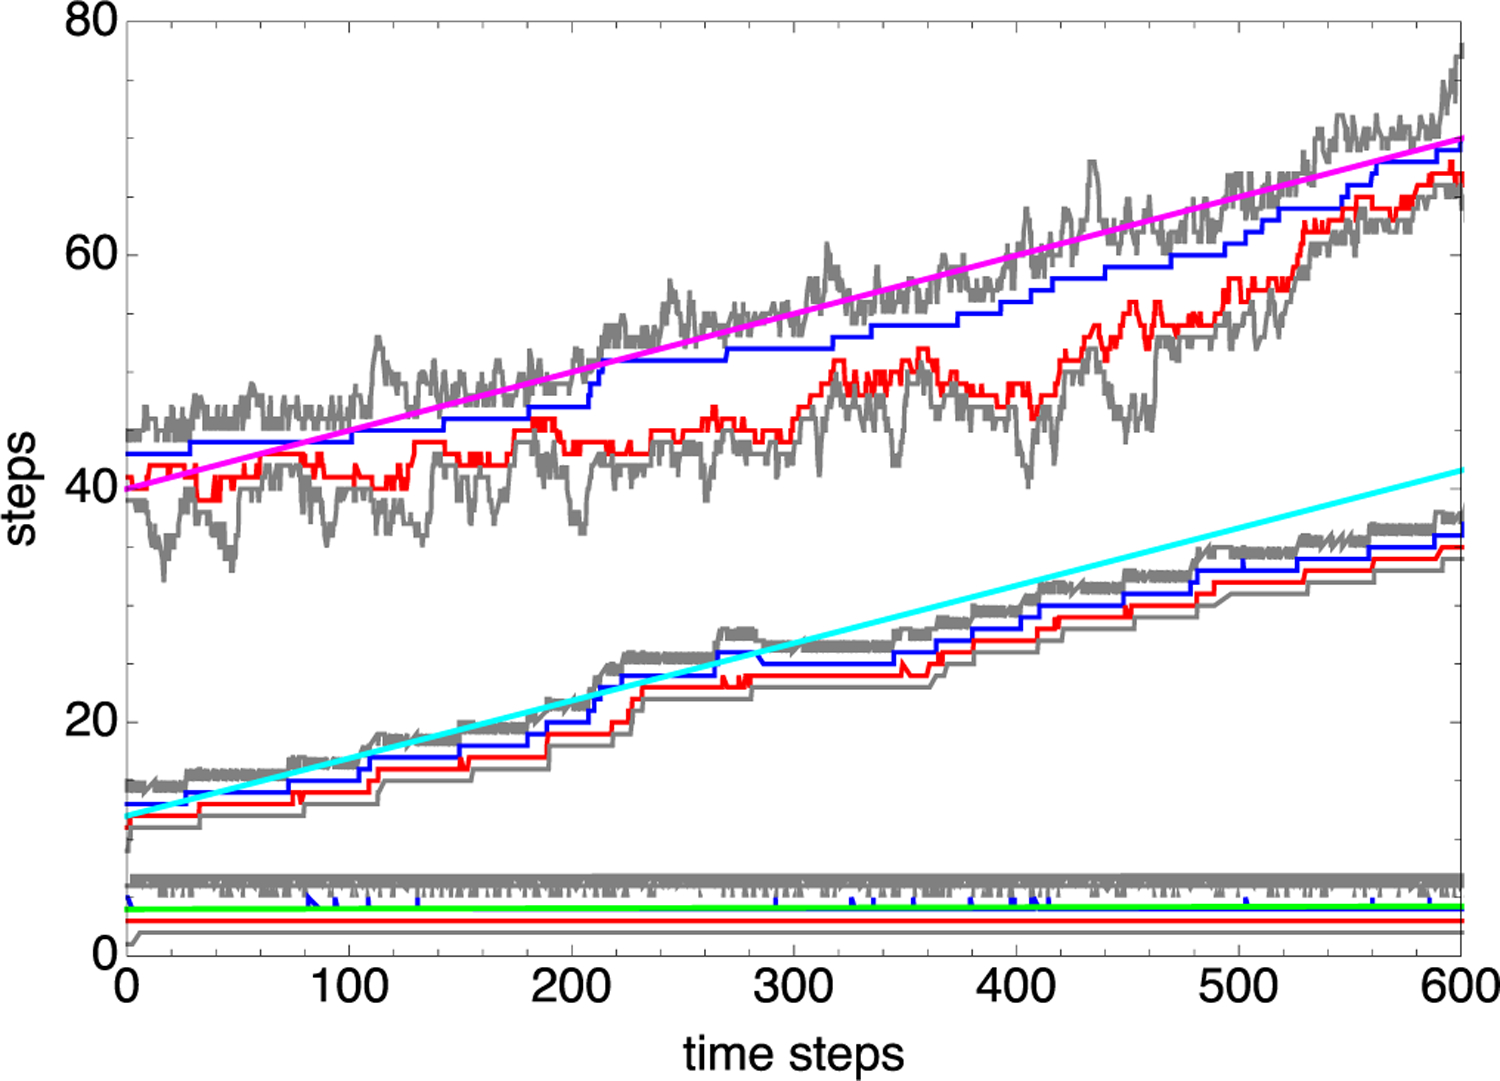
FIG. 2.

Three example composite LEF trajectories from model 2 simulations. In each case, the positions versus time of the nucleosome junctions are shown gray, the remodeling complex is shown blue, and the SMC complex is shown red. When tracking together, each such group of four traces constitutes a composite LEF. The model parameters are k+ = 0.05 per time step, k− = 5 × 10⁻⁷ per time step, m+= m−= 0.3 per time step, ΔG = 18.0kBT, α = 1 per time step, and for all three composite LEFs, but Δg = 18.0kBT for the bottom group of traces, Δg = 9.0kBT for the middle group of traces, and Δg = 0.5kBT for the top group of traces. The cyan, green, and magenta lines each have a slope given by the theoretical composite LEF velocity for the parameters of each simulation.
