
FIG. 4.
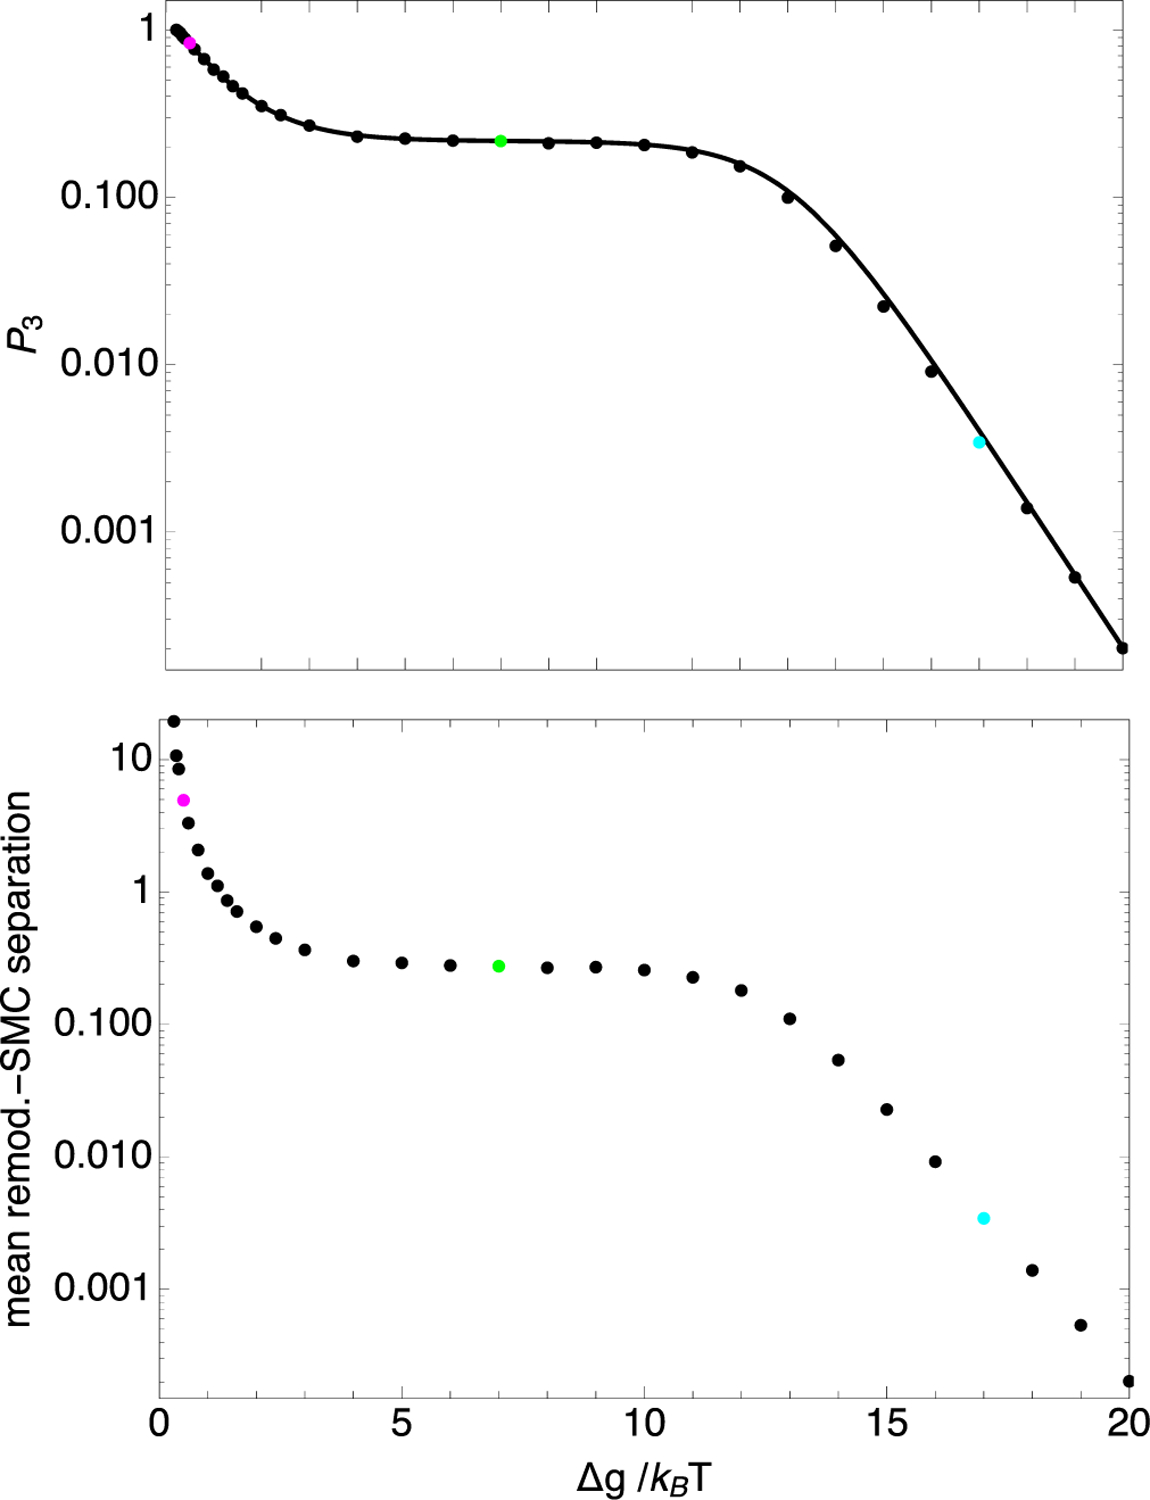
Probability, P3, that the remodeler and SMC are not next to each other (top) and the mean remodeler-SMC separation (bottom), plotted versus nucleosome binding energy, . The circles correspond to results determined from model-2 Gillepsie simulations, each containing 220 transitions. The solid line corresponds to Eq. (30). The parameter values used were k+ = 0.05 per time step, k− = 5 × 10⁻⁷ per time step, m+ = m− = 0.3 per time step, ΔG = 18.0kBT, α = 1 per time step, and . These parameters correspond to those for Fig. 2. The cyan, green, and magenta points at , 8.0, and 18, respectively, correspond to the bottom, middle, and top traces of Fig. 2.