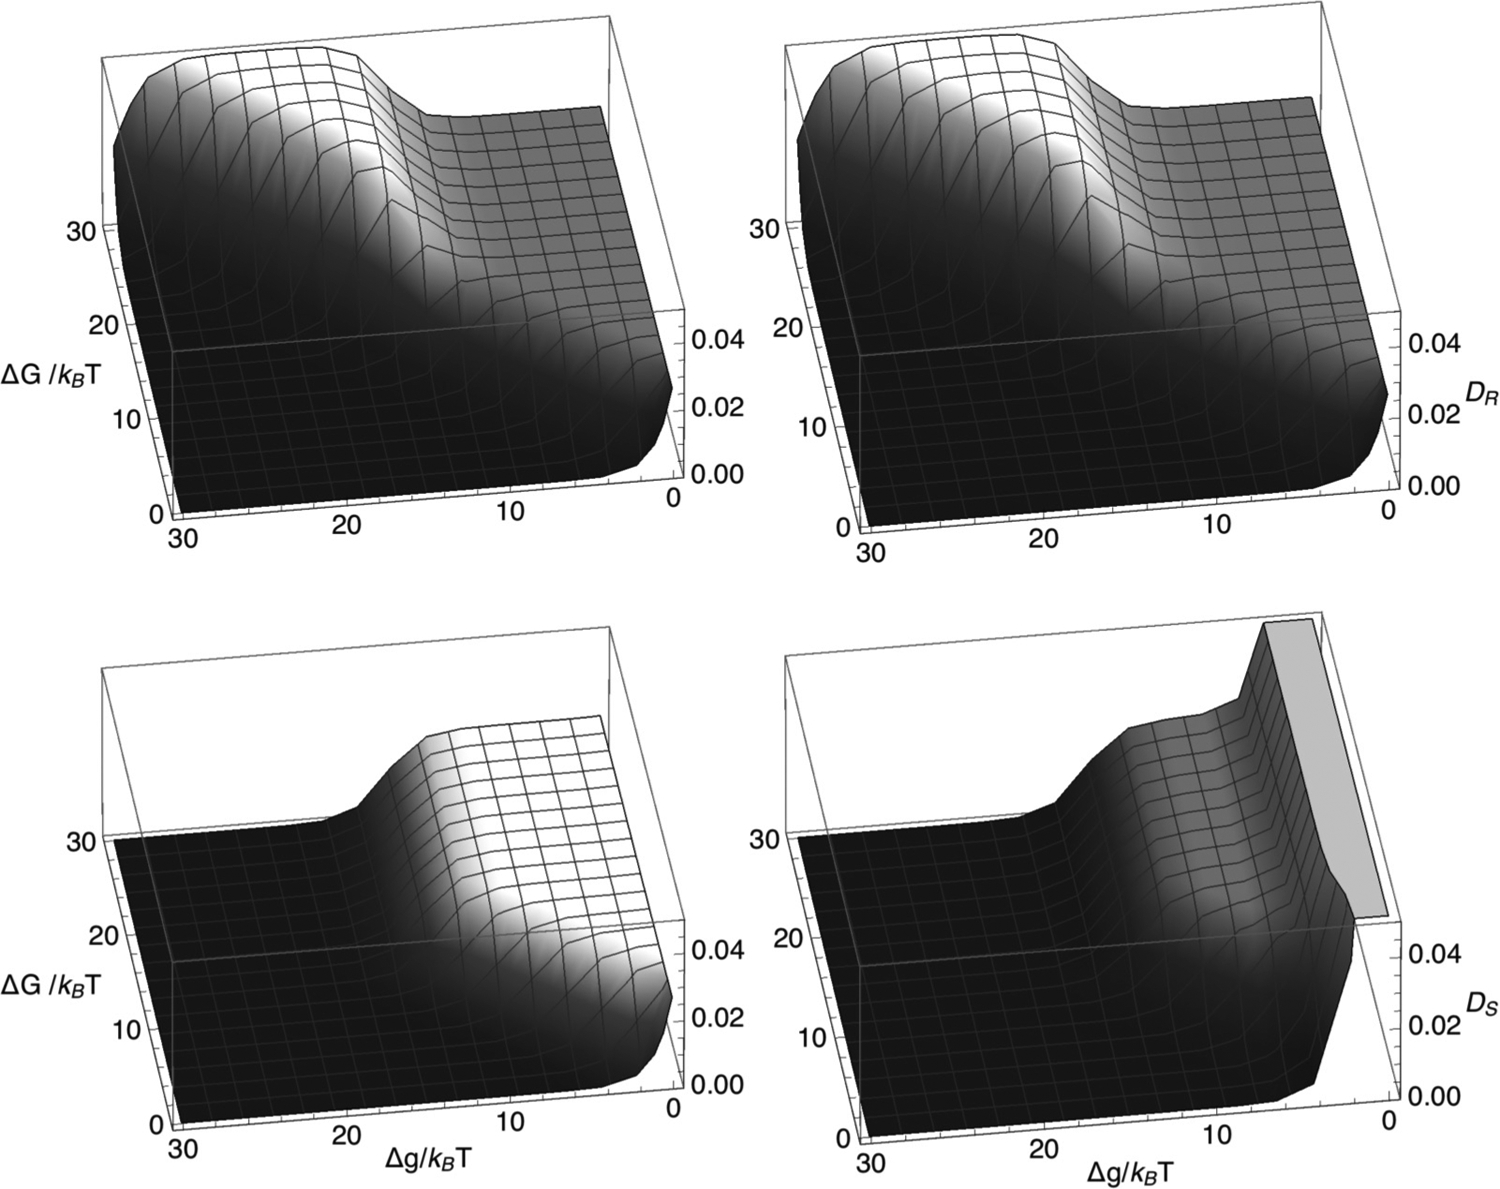
FIG. 6.

Diffusivities, DR (top row) and DS (bottom row) of the remodeling complex and the SMC complex, respectively, plotted versus ΔG/(kBT) and Δg/(kBT), according to model 1 [Eqs. (16) and (17)] for k+ = 0.05 per time step, k− = 5.0 × 10⁻⁷ per time step, m+= 0.3 per time step, and m−= 0.0003 per time step (left column) or m−= 0.3 per time step (right column).
