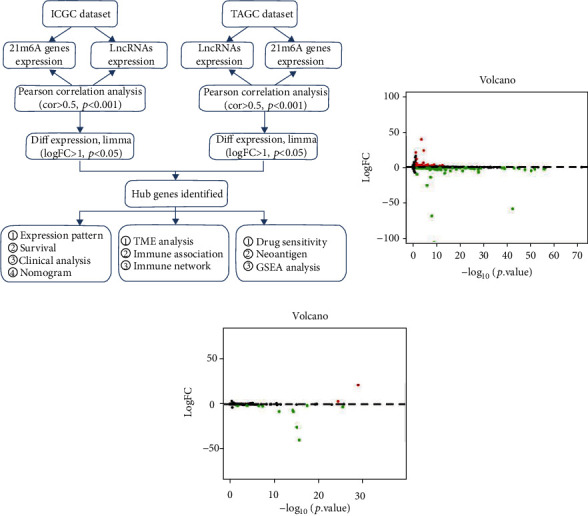
Figure 1.

m6A-related differentially expressed lncRNAs in HCC. (a) Study flow chart. (b, c) Volcano plots show the differentially expressed m6A-related lncRNA in TCGA (b) and ICGC (c). Red dot indicates upregulated and green dot indicates downregulated.
