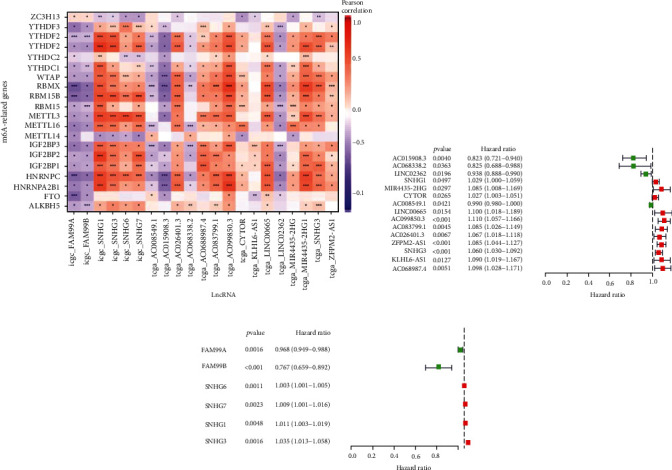
Figure 2.

Prognostic values of m6A-related differentially expressed lncRNAs. (a) Heatmap shows m6A-related prognostic lncRNAs from TCGA and ICGC databases. ∗p < 0.05; ∗∗p < 0.01; ∗∗∗p < 0.0001. (b, c) Forest plot shows the hazard ratios of m6A-related differentially expressed lncRNAs from TCGA (b) and ICGC (c). The red box indicates risk factors, and the green box indicates protective factors.
