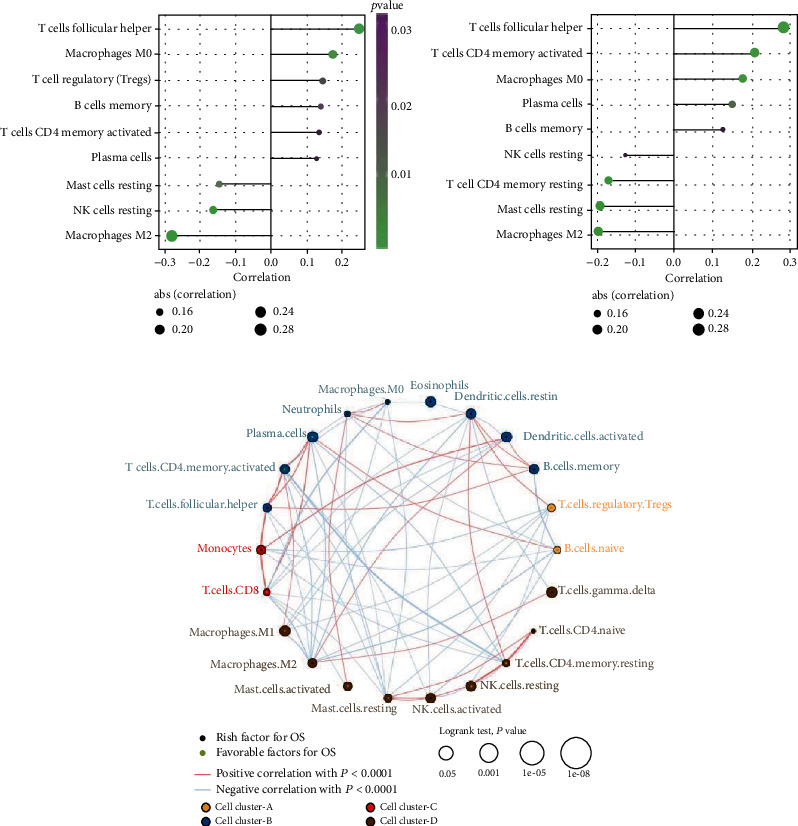
Figure 3.

Immune infiltration of landscape and the crosstalk of immune cells. (a, b) Correlation between tumor-infiltrating immune cells and SNHG1 (a) or SNHG3 (b). The size of the dot represents correlation between tumor-infiltrating immune cells and SNHG1/SNHG3. The direction of the horizontal lines indicates positive or negative correlations. The p values are indicated by colors. (c) The interaction of different types of immune cells. The size of the circle indicates p value calculated by log-rank test. Green dot in the circle indicates favorable factors for OS, and the black dot indicates risk factors for OS. The red lines linking immune cells indicate positive correlation with p < 0.01, and the blue lines indicate negative correlation with p < 0.01.
