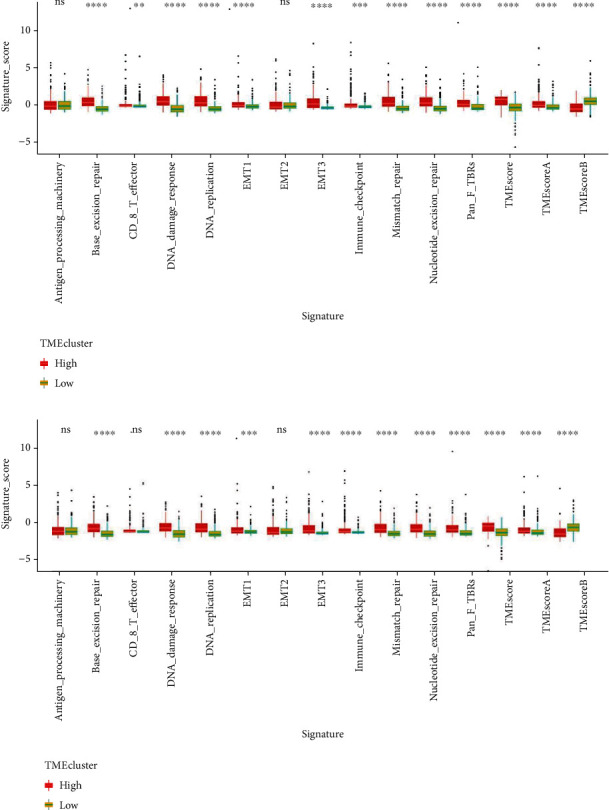
Figure 4.

Tumor microenvironment signature. “TMEclusters” was defined according to the expression level of SNHG1/SNHG3. Tumor microenvironment signature was analyzed between high- and low- SNHG1 (a) or SNHG3 (b) expression groups. ns: no significant difference, ∗p < 0.05; ∗∗p < 0.01; ∗∗∗p < 0.0001.
